

Reverse-Share-Tenancy and Marshallian Inefficiency - International ...
Reverse-Share-Tenancy and Marshallian Inefficiency - International ...
Reverse-Share-Tenancy and Marshallian Inefficiency - International ...

You also want an ePaper? Increase the reach of your titles
YUMPU automatically turns print PDFs into web optimized ePapers that Google loves.
feels the pressure of tenure insecurity due to fear of future confiscations. 9 The recent l<strong>and</strong> proclamation in<br />
the Tigray region (TNRS 2006), that prohibits leasing out more than 50 percent of a household’s own<br />
holdings <strong>and</strong> makes the l<strong>and</strong> subject to confiscation, vindicates our approach.<br />
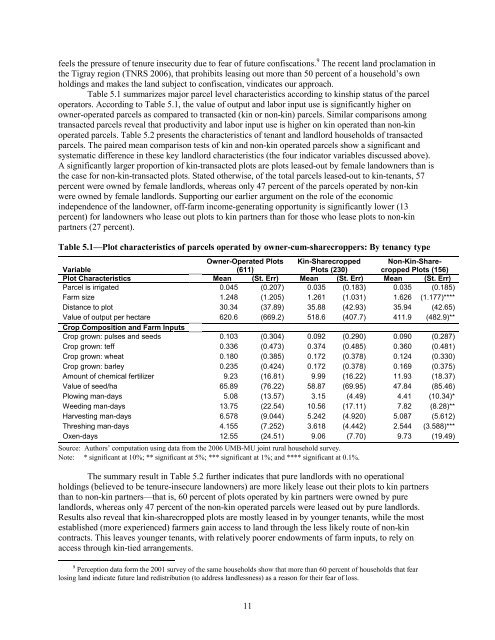
Table 5.1 summarizes major parcel level characteristics according to kinship status of the parcel<br />
operators. According to Table 5.1, the value of output <strong>and</strong> labor input use is significantly higher on<br />
owner-operated parcels as compared to transacted (kin or non-kin) parcels. Similar comparisons among<br />
transacted parcels reveal that productivity <strong>and</strong> labor input use is higher on kin operated than non-kin<br />
operated parcels. Table 5.2 presents the characteristics of tenant <strong>and</strong> l<strong>and</strong>lord households of transacted<br />
parcels. The paired mean comparison tests of kin <strong>and</strong> non-kin operated parcels show a significant <strong>and</strong><br />
systematic difference in these key l<strong>and</strong>lord characteristics (the four indicator variables discussed above).<br />
A significantly larger proportion of kin-transacted plots are plots leased-out by female l<strong>and</strong>owners than is<br />
the case for non-kin-transacted plots. Stated otherwise, of the total parcels leased-out to kin-tenants, 57<br />
percent were owned by female l<strong>and</strong>lords, whereas only 47 percent of the parcels operated by non-kin<br />
were owned by female l<strong>and</strong>lords. Supporting our earlier argument on the role of the economic<br />
independence of the l<strong>and</strong>owner, off-farm income-generating opportunity is significantly lower (13<br />
percent) for l<strong>and</strong>owners who lease out plots to kin partners than for those who lease plots to non-kin<br />
partners (27 percent).<br />
Table 5.1—Plot characteristics of parcels operated by owner-cum-sharecroppers: By tenancy type<br />
Variable<br />
Owner-Operated Plots<br />
(611)<br />
Kin-<strong>Share</strong>cropped<br />
Plots (230)<br />
Non-Kin-<strong>Share</strong>cropped<br />
Plots (156)<br />
Plot Characteristics Mean (St. Err) Mean (St. Err) Mean (St. Err)<br />
Parcel is irrigated 0.045 (0.207) 0.035 (0.183) 0.035 (0.185)<br />
Farm size 1.248 (1.205) 1.261 (1.031) 1.626 (1.177)****<br />
Distance to plot 30.34 (37.89) 35.88 (42.93) 35.94 (42.65)<br />
Value of output per hectare 620.6 (669.2) 518.6 (407.7) 411.9 (482.9)**<br />
Crop Composition <strong>and</strong> Farm Inputs<br />
Crop grown: pulses <strong>and</strong> seeds 0.103 (0.304) 0.092 (0.290) 0.090 (0.287)<br />
Crop grown: teff 0.336 (0.473) 0.374 (0.485) 0.360 (0.481)<br />
Crop grown: wheat 0.180 (0.385) 0.172 (0.378) 0.124 (0.330)<br />
Crop grown: barley 0.235 (0.424) 0.172 (0.378) 0.169 (0.375)<br />
Amount of chemical fertilizer 9.23 (16.81) 9.99 (16.22) 11.93 (18.37)<br />
Value of seed/ha 65.89 (76.22) 58.87 (69.95) 47.84 (85.46)<br />
Plowing man-days 5.08 (13.57) 3.15 (4.49) 4.41 (10.34)*<br />
Weeding man-days 13.75 (22.54) 10.56 (17.11) 7.82 (8.28)**<br />
Harvesting man-days 6.578 (9.044) 5.242 (4.920) 5.087 (5.612)<br />
Threshing man-days 4.155 (7.252) 3.618 (4.442) 2.544 (3.588)***<br />
Oxen-days 12.55 (24.51) 9.06 (7.70) 9.73 (19.49)<br />
Source: Authors’ computation using data from the 2006 UMB-MU joint rural household survey.<br />
Note: * significant at 10%; ** significant at 5%; *** significant at 1%; <strong>and</strong> **** significant at 0.1%.<br />
The summary result in Table 5.2 further indicates that pure l<strong>and</strong>lords with no operational<br />
holdings (believed to be tenure-insecure l<strong>and</strong>owners) are more likely lease out their plots to kin partners<br />
than to non-kin partners—that is, 60 percent of plots operated by kin partners were owned by pure<br />
l<strong>and</strong>lords, whereas only 47 percent of the non-kin operated parcels were leased out by pure l<strong>and</strong>lords.<br />
Results also reveal that kin-sharecropped plots are mostly leased in by younger tenants, while the most<br />
established (more experienced) farmers gain access to l<strong>and</strong> through the less likely route of non-kin<br />
contracts. This leaves younger tenants, with relatively poorer endowments of farm inputs, to rely on<br />
access through kin-tied arrangements.<br />
9 Perception data form the 2001 survey of the same households show that more than 60 percent of households that fear<br />
losing l<strong>and</strong> indicate future l<strong>and</strong> redistribution (to address l<strong>and</strong>lessness) as a reason for their fear of loss.<br />
11


