

Reverse-Share-Tenancy and Marshallian Inefficiency - International ...
Reverse-Share-Tenancy and Marshallian Inefficiency - International ...
Reverse-Share-Tenancy and Marshallian Inefficiency - International ...

You also want an ePaper? Increase the reach of your titles
YUMPU automatically turns print PDFs into web optimized ePapers that Google loves.
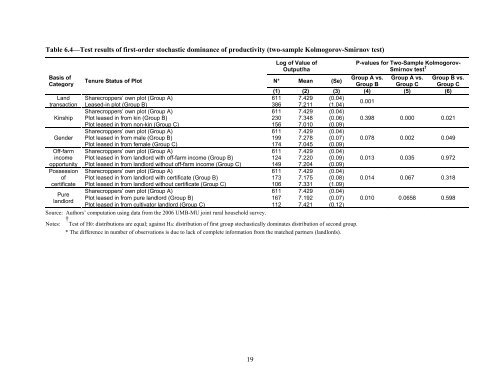
Table 6.4—Test results of first-order stochastic dominance of productivity (two-sample Kolmogorov-Smirnov test)<br />
Log of Value of<br />
Output/ha<br />
P-values for Two-Sample Kolmogorov-<br />
Smirnov test †<br />
Basis of<br />
Group A vs. Group A vs. Group B vs.<br />
Tenure Status of Plot N* Mean (Se)<br />
Category<br />
Group B Group C Group C<br />
(1) (2) (3) (4) (5) (6)<br />
L<strong>and</strong> <strong>Share</strong>croppers’ own plot (Group A) 611 7.429 (0.04)<br />
transaction Leased-in plot (Group B) 386 7.211 (1.04)<br />
0.001<br />
<strong>Share</strong>croppers’ own plot (Group A) 611 7.429 (0.04)<br />
Kinship Plot leased in from kin (Group B) 230 7.348 (0.06) 0.398 0.000 0.021<br />
Plot leased in from non-kin (Group C) 156 7.010 (0.09)<br />
<strong>Share</strong>croppers’ own plot (Group A) 611 7.429 (0.04)<br />
Gender Plot leased in from male (Group B) 199 7.278 (0.07) 0.078 0.002 0.049<br />
Plot leased in from female (Group C) 174 7.045 (0.09)<br />
Off-farm <strong>Share</strong>croppers’ own plot (Group A) 611 7.429 (0.04)<br />
income Plot leased in from l<strong>and</strong>lord with off-farm income (Group B) 124 7.220 (0.09) 0.013 0.035 0.972<br />
opportunity Plot leased in from l<strong>and</strong>lord without off-farm income (Group C) 149 7.204 (0.09)<br />
Possession <strong>Share</strong>croppers’ own plot (Group A) 611 7.429 (0.04)<br />
of Plot leased in from l<strong>and</strong>lord with certificate (Group B) 173 7.175 (0.08) 0.014 0.067 0.318<br />
certificate Plot leased in from l<strong>and</strong>lord without certificate (Group C) 106 7.331 (1.09)<br />
<strong>Share</strong>croppers’ own plot (Group A) 611 7.429 (0.04)<br />
Pure<br />
Plot leased in from pure l<strong>and</strong>lord (Group B) 167 7.192 (0.07)<br />
l<strong>and</strong>lord<br />
Plot leased in from cultivator l<strong>and</strong>lord (Group C) 112 7.421 (0.12)<br />
0.010 0.0658 0.598<br />
Source: Authors’ computation using data from the 2006 UMB-MU joint rural household survey.<br />
Notes:<br />
† Test of H0: distributions are equal; against Ha: distribution of first group stochastically dominates distribution of second group.<br />
* The difference in number of observations is due to lack of complete information from the matched partners (l<strong>and</strong>lords).<br />
19


