

Reverse-Share-Tenancy and Marshallian Inefficiency - International ...
Reverse-Share-Tenancy and Marshallian Inefficiency - International ...
Reverse-Share-Tenancy and Marshallian Inefficiency - International ...

Create successful ePaper yourself
Turn your PDF publications into a flip-book with our unique Google optimized e-Paper software.
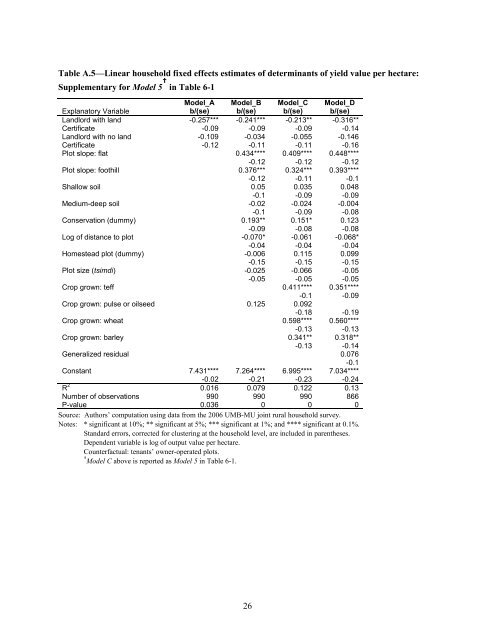
Table A.5—Linear household fixed effects estimates of determinants of yield value per hectare:<br />
Supplementary for Model 5 † in Table 6-1<br />
Model_A Model_B Model_C Model_D<br />
Explanatory Variable b/(se) b/(se) b/(se) b/(se)<br />
L<strong>and</strong>lord with l<strong>and</strong> -0.257*** -0.241*** -0.213** -0.316**<br />
Certificate -0.09 -0.09 -0.09 -0.14<br />
L<strong>and</strong>lord with no l<strong>and</strong> -0.109 -0.034 -0.055 -0.146<br />
Certificate -0.12 -0.11 -0.11 -0.16<br />
Plot slope: flat 0.434**** 0.409**** 0.448****<br />
-0.12 -0.12 -0.12<br />
Plot slope: foothill 0.376*** 0.324*** 0.393****<br />
-0.12 -0.11 -0.1<br />
Shallow soil 0.05 0.035 0.048<br />
-0.1 -0.09 -0.09<br />
Medium-deep soil -0.02 -0.024 -0.004<br />
-0.1 -0.09 -0.08<br />
Conservation (dummy) 0.193** 0.151* 0.123<br />
-0.09 -0.08 -0.08<br />
Log of distance to plot -0.070* -0.061 -0.068*<br />
-0.04 -0.04 -0.04<br />
Homestead plot (dummy) -0.006 0.115 0.099<br />
-0.15 -0.15 -0.15<br />
Plot size (tsimdi) -0.025 -0.066 -0.05<br />
-0.05 -0.05 -0.05<br />
Crop grown: teff 0.411**** 0.351****<br />
-0.1 -0.09<br />
Crop grown: pulse or oilseed 0.125 0.092<br />
-0.18 -0.19<br />
Crop grown: wheat 0.598**** 0.560****<br />
-0.13 -0.13<br />
Crop grown: barley 0.341** 0.318**<br />
-0.13 -0.14<br />
Generalized residual 0.076<br />
-0.1<br />
Constant 7.431**** 7.264**** 6.995**** 7.034****<br />
-0.02 -0.21 -0.23 -0.24<br />
R 2 0.016 0.079 0.122 0.13<br />
Number of observations 990 990 990 866<br />
P-value 0.036 0 0 0<br />
Source: Authors’ computation using data from the 2006 UMB-MU joint rural household survey.<br />
Notes: * significant at 10%; ** significant at 5%; *** significant at 1%; <strong>and</strong> **** significant at 0.1%.<br />
St<strong>and</strong>ard errors, corrected for clustering at the household level, are included in parentheses.<br />
Dependent variable is log of output value per hectare.<br />
Counterfactual: tenants’ owner-operated plots.<br />
† Model C above is reported as Model 5 in Table 6-1.<br />
26


