

Reverse-Share-Tenancy and Marshallian Inefficiency - International ...
Reverse-Share-Tenancy and Marshallian Inefficiency - International ...
Reverse-Share-Tenancy and Marshallian Inefficiency - International ...

You also want an ePaper? Increase the reach of your titles
YUMPU automatically turns print PDFs into web optimized ePapers that Google loves.
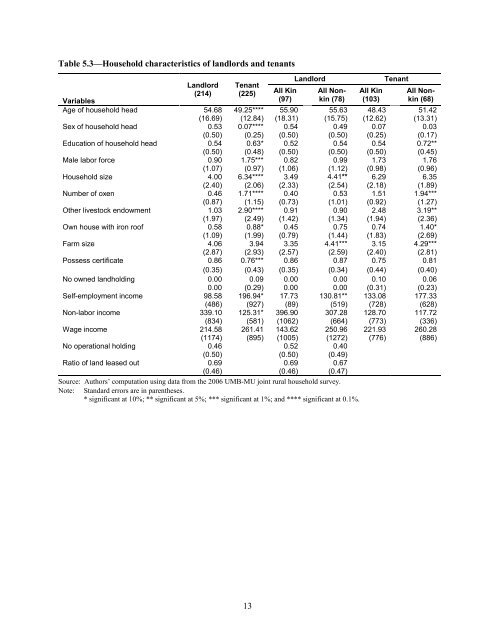
Table 5.3—Household characteristics of l<strong>and</strong>lords <strong>and</strong> tenants<br />
L<strong>and</strong>lord<br />
(214)<br />
Tenant<br />
(225)<br />
All Kin<br />
(97)<br />
L<strong>and</strong>lord<br />
All Nonkin<br />
(78)<br />
All Kin<br />
(103)<br />
Tenant<br />
All Nonkin<br />
(68)<br />
Variables<br />
Age of household head 54.68 49.25**** 55.90 55.63 48.43 51.42<br />
(16.69) (12.84) (18.31) (15.75) (12.62) (13.31)<br />
Sex of household head 0.53 0.07**** 0.54 0.49 0.07 0.03<br />
(0.50) (0.25) (0.50) (0.50) (0.25) (0.17)<br />
Education of household head 0.54 0.63* 0.52 0.54 0.54 0.72**<br />
(0.50) (0.48) (0.50) (0.50) (0.50) (0.45)<br />
Male labor force 0.90 1.75*** 0.82 0.99 1.73 1.76<br />
(1.07) (0.97) (1.06) (1.12) (0.98) (0.96)<br />
Household size 4.00 6.34**** 3.49 4.41** 6.29 6.35<br />
(2.40) (2.06) (2.33) (2.54) (2.18) (1.89)<br />
Number of oxen 0.46 1.71**** 0.40 0.53 1.51 1.94***<br />
(0.87) (1.15) (0.73) (1.01) (0.92) (1.27)<br />
Other livestock endowment 1.03 2.90**** 0.91 0.90 2.48 3.19**<br />
(1.97) (2.49) (1.42) (1.34) (1.94) (2.36)<br />
Own house with iron roof 0.58 0.88* 0.45 0.75 0.74 1.40*<br />
(1.09) (1.99) (0.79) (1.44) (1.83) (2.69)<br />
Farm size 4.06 3.94 3.35 4.41*** 3.15 4.29***<br />
(2.87) (2.93) (2.57) (2.59) (2.40) (2.81)<br />
Possess certificate 0.86 0.76*** 0.86 0.87 0.75 0.81<br />
(0.35) (0.43) (0.35) (0.34) (0.44) (0.40)<br />
No owned l<strong>and</strong>holding 0.00 0.09 0.00 0.00 0.10 0.06<br />
0.00 (0.29) 0.00 0.00 (0.31) (0.23)<br />
Self-employment income 98.58 196.94* 17.73 130.81** 133.08 177.33<br />
(486) (927) (89) (519) (728) (628)<br />
Non-labor income 339.10 125.31* 396.90 307.28 128.70 117.72<br />
(834) (581) (1062) (664) (773) (336)<br />
Wage income 214.58 261.41 143.62 250.96 221.93 260.28<br />
(1174) (895) (1005) (1272) (776) (886)<br />
No operational holding 0.46 0.52 0.40<br />
(0.50) (0.50) (0.49)<br />
Ratio of l<strong>and</strong> leased out 0.69 0.69 0.67<br />
(0.46) (0.46) (0.47)<br />
Source: Authors’ computation using data from the 2006 UMB-MU joint rural household survey.<br />
Note: St<strong>and</strong>ard errors are in parentheses.<br />
* significant at 10%; ** significant at 5%; *** significant at 1%; <strong>and</strong> **** significant at 0.1%.<br />
13


