

Reverse-Share-Tenancy and Marshallian Inefficiency - International ...
Reverse-Share-Tenancy and Marshallian Inefficiency - International ...
Reverse-Share-Tenancy and Marshallian Inefficiency - International ...

Create successful ePaper yourself
Turn your PDF publications into a flip-book with our unique Google optimized e-Paper software.
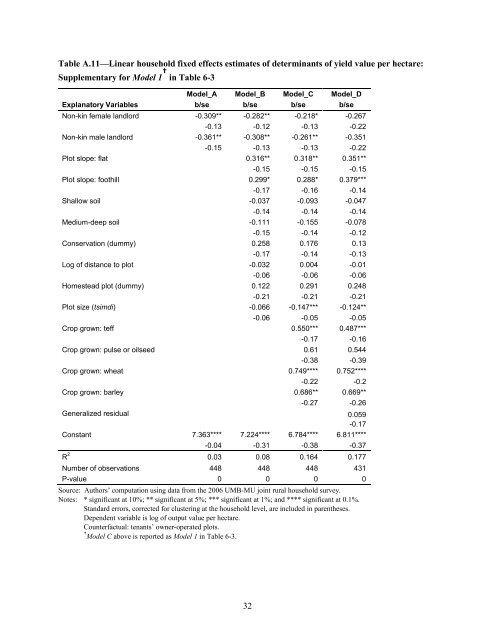
Table A.11—Linear household fixed effects estimates of determinants of yield value per hectare:<br />
Supplementary for Model 1 † in Table 6-3<br />
Model_A Model_B Model_C Model_D<br />
Explanatory Variables b/se b/se b/se b/se<br />
Non-kin female l<strong>and</strong>lord -0.309** -0.282** -0.218* -0.267<br />
-0.13 -0.12 -0.13 -0.22<br />
Non-kin male l<strong>and</strong>lord -0.361** -0.308** -0.261** -0.351<br />
-0.15 -0.13 -0.13 -0.22<br />
Plot slope: flat 0.316** 0.318** 0.351**<br />
-0.15 -0.15 -0.15<br />
Plot slope: foothill 0.299* 0.288* 0.379***<br />
-0.17 -0.16 -0.14<br />
Shallow soil -0.037 -0.093 -0.047<br />
-0.14 -0.14 -0.14<br />
Medium-deep soil -0.111 -0.155 -0.078<br />
-0.15 -0.14 -0.12<br />
Conservation (dummy) 0.258 0.176 0.13<br />
-0.17 -0.14 -0.13<br />
Log of distance to plot -0.032 0.004 -0.01<br />
-0.06 -0.06 -0.06<br />
Homestead plot (dummy) 0.122 0.291 0.248<br />
-0.21 -0.21 -0.21<br />
Plot size (tsimdi) -0.066 -0.147*** -0.124**<br />
-0.06 -0.05 -0.05<br />
Crop grown: teff 0.550*** 0.487***<br />
-0.17 -0.16<br />
Crop grown: pulse or oilseed 0.61 0.544<br />
-0.38 -0.39<br />
Crop grown: wheat 0.749**** 0.752****<br />
-0.22 -0.2<br />
Crop grown: barley 0.686** 0.669**<br />
-0.27 -0.26<br />
Generalized residual 0.059<br />
-0.17<br />
Constant 7.363**** 7.224**** 6.784**** 6.811****<br />
-0.04 -0.31 -0.38 -0.37<br />
R 2 0.03 0.08 0.164 0.177<br />
Number of observations 448 448 448 431<br />
P-value 0 0 0 0<br />
Source: Authors’ computation using data from the 2006 UMB-MU joint rural household survey.<br />
Notes: * significant at 10%; ** significant at 5%; *** significant at 1%; <strong>and</strong> **** significant at 0.1%.<br />
St<strong>and</strong>ard errors, corrected for clustering at the household level, are included in parentheses.<br />
Dependent variable is log of output value per hectare.<br />
Counterfactual: tenants’ owner-operated plots.<br />
† Model C above is reported as Model 1 in Table 6-3.<br />
32


