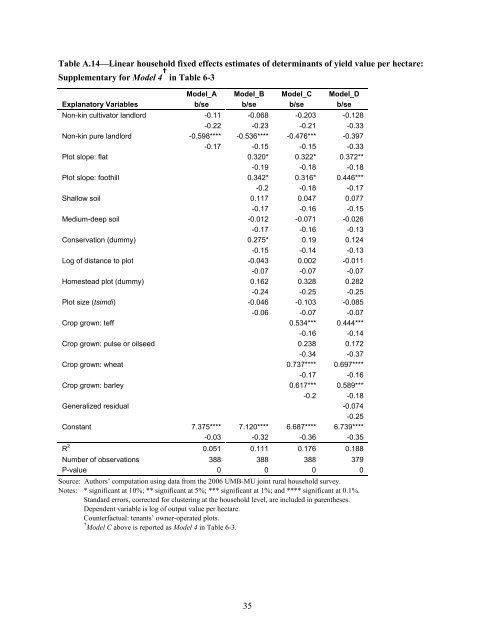
Table A.14—Linear household fixed effects estimates of determinants of yield value per hectare: Supplementary for Model 4 † in Table 6-3 Model_A Model_B Model_C Model_D Explanatory Variables b/se b/se b/se b/se Non-kin cultivator l<strong>and</strong>lord -0.11 -0.068 -0.203 -0.128 -0.22 -0.23 -0.21 -0.33 Non-kin pure l<strong>and</strong>lord -0.598**** -0.536**** -0.476*** -0.397 -0.17 -0.15 -0.15 -0.33 Plot slope: flat 0.320* 0.322* 0.372** -0.19 -0.18 -0.18 Plot slope: foothill 0.342* 0.316* 0.446*** -0.2 -0.18 -0.17 Shallow soil 0.117 0.047 0.077 -0.17 -0.16 -0.15 Medium-deep soil -0.012 -0.071 -0.026 -0.17 -0.16 -0.13 Conservation (dummy) 0.275* 0.19 0.124 -0.15 -0.14 -0.13 Log of distance to plot -0.043 0.002 -0.011 -0.07 -0.07 -0.07 Homestead plot (dummy) 0.162 0.328 0.282 -0.24 -0.25 -0.25 Plot size (tsimdi) -0.046 -0.103 -0.085 -0.06 -0.07 -0.07 Crop grown: teff 0.534*** 0.444*** -0.16 -0.14 Crop grown: pulse or oilseed 0.238 0.172 -0.34 -0.37 Crop grown: wheat 0.737**** 0.697**** -0.17 -0.16 Crop grown: barley 0.617*** 0.589*** -0.2 -0.18 Generalized residual -0.074 -0.25 Constant 7.375**** 7.120**** 6.687**** 6.739**** -0.03 -0.32 -0.36 -0.35 R 2 0.051 0.111 0.176 0.188 Number of observations 388 388 388 379 P-value 0 0 0 0 Source: Authors’ computation using data from the 2006 UMB-MU joint rural household survey. Notes: * significant at 10%; ** significant at 5%; *** significant at 1%; <strong>and</strong> **** significant at 0.1%. St<strong>and</strong>ard errors, corrected for clustering at the household level, are included in parentheses. Dependent variable is log of output value per hectare. Counterfactual: tenants’ owner-operated plots. † Model C above is reported as Model 4 in Table 6-3. 35
REFERENCES Adal, Y., 2002. Review of L<strong>and</strong>holding Systems <strong>and</strong> Policies in Ethiopia under the Different Regimes, EEA/Economic Policy Research Institute, Working paper No 5/2002. Addis Ababa, Ethiopia. Alemu, T., 1999. L<strong>and</strong> Tenure <strong>and</strong> Soil Conservation: Evidences from Ethiopia. Unpublished PhD-dissertation, Göteborg University, Göteborg. Arc<strong>and</strong>, J. L., Ai, C. R., Ethier, F., 2007. “Moral Hazard <strong>and</strong> <strong>Marshallian</strong> <strong>Inefficiency</strong>: Evidence from Tunisia.” Journal of Development Economics. 83, 411-445. Arrow, K. J., 1968. “The Economics of Moral Hazard: Further Comment.” American Economic Review. 58. Aryal, J. P., Holden, S. T., 2012. “Livestock <strong>and</strong> L<strong>and</strong> <strong>Share</strong> Contracts in a Hindu Society.” Agricultural Economics. 43, 1-14. Bellemare, M., 2006. Testing between Competing Theories of <strong>Reverse</strong> <strong>Share</strong> <strong>Tenancy</strong>, Durham, NC: Duke University. Bellemare, M. F., 2008. Insecure L<strong>and</strong> Rights <strong>and</strong> <strong>Reverse</strong> <strong>Share</strong> <strong>Tenancy</strong> in Madagascar. Durham , NC: Duke University. Besley, T., Coast, E., 1995. “Group Lending, Repayment Incentives <strong>and</strong> Social Collateral.” Journal Development Economics. 46, 1-18. Bezabih, M., Holden, S. T., 2010. The Role of L<strong>and</strong> Certification in Reducing Gender Gaps in Productivity in Rural Ethiopia. Environment for Development, Discussion Paper Series No. EfD-DP 10-23. Bezabih, M., Holden, S. T., Mannberg, A., 2012. The Role of L<strong>and</strong> Certification in Reducing Gender Gaps in Productivity in Rural Ethiopia. CLTS Working Paper No. 1/2012. Centre for L<strong>and</strong> Tenure Studies, Norwegian University of Life Sciences, Ås, Norway. Bliss, C. J., Stern, N. H., 1982. Palanpur: The Economy of an Indian Village. Delhi <strong>and</strong> New York: Oxford University Press. Deininger, K., Ali, D. A., Alemu, T., 2008. “L<strong>and</strong> Rental Markets: Transaction Costs <strong>and</strong> Tenure Isecurity in Rural Ethiopia.” In The Emergence of L<strong>and</strong> Markets in Africa: Impacts on Poverty, Equity, <strong>and</strong> Efficiency, edited by S. T. Holden, K. Otsuka <strong>and</strong> F. M. Place. Washington DC:Resource For the Future. Deininger, K., Ali, D. A., Alemu, T., 2011. “Impacts of L<strong>and</strong> Certification on Tenure Security, Investment, <strong>and</strong> L<strong>and</strong> Markets.” L<strong>and</strong> Economics. 87, 312-334. Deininger, K., Ali, D. A., Holden, S., Zevenbergen, J., 2008. Rural L<strong>and</strong> Certification in Ethiopia: Process, Initial Impact, <strong>and</strong> Implications for Other African Countries, World Development. 36, 1786-1812. Deininger, K., Feder, G., 1998. L<strong>and</strong> Institutions <strong>and</strong> L<strong>and</strong> Markets, The World Bank, Development Research Group, Rural Development.Washington, DC. Fafchamps, M., 2004. Market Institutions in Sub-Saharan Africa. Cambridge, Massachusettes: The MIT Press. Feder, G., Onchan, T., Chalamwong, Y., 1988. “L<strong>and</strong> Policies <strong>and</strong> Farm Performance in Thail<strong>and</strong>'s Forest Reserve Areas.” Economic Development <strong>and</strong> Culture Change. 36, 483-501. Gavian, S., Ehui, S., 1999. “Measuring the Production Efficiency of Alternative L<strong>and</strong> Tenure Contracts in a Mixed Crop-Livestock System in Ethiopia.” Agricultural Economics. 20, 37-49. Ghebru, H., 2009. L<strong>and</strong>, L<strong>and</strong> Rental Markets <strong>and</strong> Rural Poverty Dynamics in the Tigray Region of Ethiopia, Paper presented at the Annual Conference of the Norwegian Association for Development Research (NFU). November 23-24, Kristians<strong>and</strong> , Norway. Ghebru, H. H., Holden, S. T., 2008. “Factor Market Imperfections <strong>and</strong> Rural L<strong>and</strong> Rental Markets in Northern Ethiopian Highl<strong>and</strong>s.” In The Emergence of L<strong>and</strong> Markets in Africa: Impacts on Poverty, Equity, <strong>and</strong> Efficiency, edited by S. T. Holden, K. Otsuka <strong>and</strong> F. M. Place. Washington DC :Resource For the Future (RFF). 36