

Reverse-Share-Tenancy and Marshallian Inefficiency - International ...
Reverse-Share-Tenancy and Marshallian Inefficiency - International ...
Reverse-Share-Tenancy and Marshallian Inefficiency - International ...

Create successful ePaper yourself
Turn your PDF publications into a flip-book with our unique Google optimized e-Paper software.
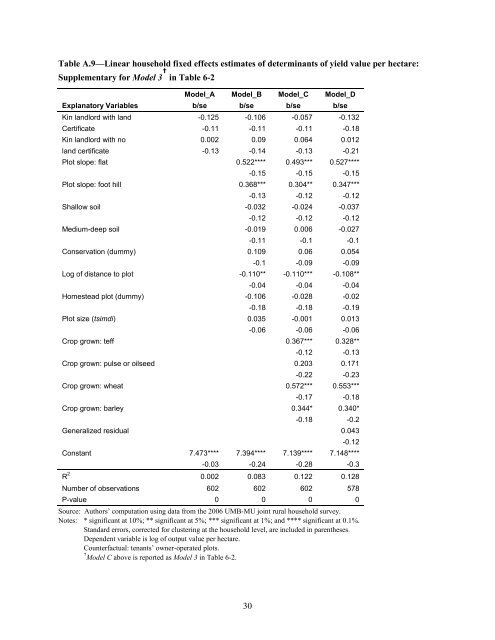
Table A.9—Linear household fixed effects estimates of determinants of yield value per hectare:<br />
Supplementary for Model 3 † in Table 6-2<br />
Model_A Model_B Model_C Model_D<br />
Explanatory Variables b/se b/se b/se b/se<br />
Kin l<strong>and</strong>lord with l<strong>and</strong> -0.125 -0.106 -0.057 -0.132<br />
Certificate -0.11 -0.11 -0.11 -0.18<br />
Kin l<strong>and</strong>lord with no 0.002 0.09 0.064 0.012<br />
l<strong>and</strong> certificate -0.13 -0.14 -0.13 -0.21<br />
Plot slope: flat 0.522**** 0.493*** 0.527****<br />
-0.15 -0.15 -0.15<br />
Plot slope: foot hill 0.368*** 0.304** 0.347***<br />
-0.13 -0.12 -0.12<br />
Shallow soil -0.032 -0.024 -0.037<br />
-0.12 -0.12 -0.12<br />
Medium-deep soil -0.019 0.006 -0.027<br />
-0.11 -0.1 -0.1<br />
Conservation (dummy) 0.109 0.06 0.054<br />
-0.1 -0.09 -0.09<br />
Log of distance to plot -0.110** -0.110*** -0.108**<br />
-0.04 -0.04 -0.04<br />
Homestead plot (dummy) -0.106 -0.028 -0.02<br />
-0.18 -0.18 -0.19<br />
Plot size (tsimdi) 0.035 -0.001 0.013<br />
-0.06 -0.06 -0.06<br />
Crop grown: teff 0.367*** 0.328**<br />
-0.12 -0.13<br />
Crop grown: pulse or oilseed 0.203 0.171<br />
-0.22 -0.23<br />
Crop grown: wheat 0.572*** 0.553***<br />
-0.17 -0.18<br />
Crop grown: barley 0.344* 0.340*<br />
-0.18 -0.2<br />
Generalized residual 0.043<br />
-0.12<br />
Constant 7.473**** 7.394**** 7.139**** 7.148****<br />
-0.03 -0.24 -0.28 -0.3<br />
R 2 0.002 0.083 0.122 0.128<br />
Number of observations 602 602 602 578<br />
P-value 0 0 0 0<br />
Source: Authors’ computation using data from the 2006 UMB-MU joint rural household survey.<br />
Notes: * significant at 10%; ** significant at 5%; *** significant at 1%; <strong>and</strong> **** significant at 0.1%.<br />
St<strong>and</strong>ard errors, corrected for clustering at the household level, are included in parentheses.<br />
Dependent variable is log of output value per hectare.<br />
Counterfactual: tenants’ owner-operated plots.<br />
† Model C above is reported as Model 3 in Table 6-2.<br />
30


