

Reverse-Share-Tenancy and Marshallian Inefficiency - International ...
Reverse-Share-Tenancy and Marshallian Inefficiency - International ...
Reverse-Share-Tenancy and Marshallian Inefficiency - International ...

You also want an ePaper? Increase the reach of your titles
YUMPU automatically turns print PDFs into web optimized ePapers that Google loves.
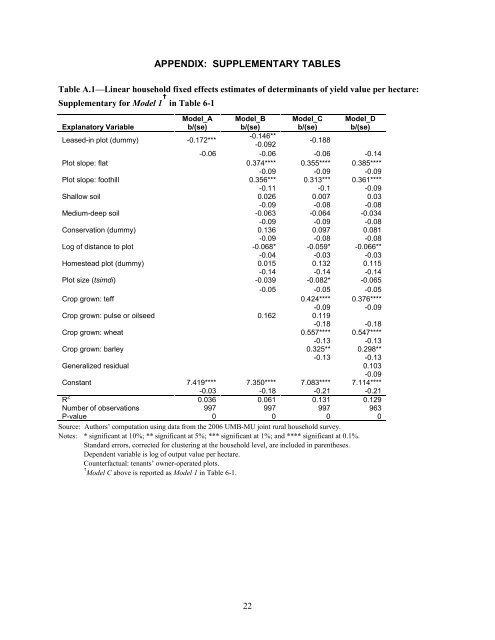
APPENDIX: SUPPLEMENTARY TABLES<br />
Table A.1—Linear household fixed effects estimates of determinants of yield value per hectare:<br />
Supplementary for Model 1 † in Table 6-1<br />
Model_A Model_B Model_C Model_D<br />
Explanatory Variable b/(se) b/(se) b/(se) b/(se)<br />
Leased-in plot (dummy) -0.172***<br />
-0.146**<br />
-0.092<br />
-0.188<br />
-0.06 -0.06 -0.06 -0.14<br />
Plot slope: flat 0.374**** 0.355**** 0.385****<br />
-0.09 -0.09 -0.09<br />
Plot slope: foothill 0.356*** 0.313*** 0.361****<br />
-0.11 -0.1 -0.09<br />
Shallow soil 0.026 0.007 0.03<br />
-0.09 -0.08 -0.08<br />
Medium-deep soil -0.063 -0.064 -0.034<br />
-0.09 -0.09 -0.08<br />
Conservation (dummy) 0.136 0.097 0.081<br />
-0.09 -0.08 -0.08<br />
Log of distance to plot -0.068* -0.059* -0.066**<br />
-0.04 -0.03 -0.03<br />
Homestead plot (dummy) 0.015 0.132 0.115<br />
-0.14 -0.14 -0.14<br />
Plot size (tsimdi) -0.039 -0.082* -0.065<br />
-0.05 -0.05 -0.05<br />
Crop grown: teff 0.424**** 0.376****<br />
-0.09 -0.09<br />
Crop grown: pulse or oilseed 0.162 0.119<br />
-0.18 -0.18<br />
Crop grown: wheat 0.557**** 0.547****<br />
-0.13 -0.13<br />
Crop grown: barley 0.325** 0.298**<br />
-0.13 -0.13<br />
Generalized residual 0.103<br />
-0.09<br />
Constant 7.419**** 7.350**** 7.083**** 7.114****<br />
-0.03 -0.18 -0.21 -0.21<br />
R 2 0.036 0.061 0.131 0.129<br />
Number of observations 997 997 997 963<br />
P-value 0 0 0 0<br />
Source: Authors’ computation using data from the 2006 UMB-MU joint rural household survey.<br />
Notes: * significant at 10%; ** significant at 5%; *** significant at 1%; <strong>and</strong> **** significant at 0.1%.<br />
St<strong>and</strong>ard errors, corrected for clustering at the household level, are included in parentheses.<br />
Dependent variable is log of output value per hectare.<br />
Counterfactual: tenants’ owner-operated plots.<br />
† Model C above is reported as Model 1 in Table 6-1.<br />
22


