

Reverse-Share-Tenancy and Marshallian Inefficiency - International ...
Reverse-Share-Tenancy and Marshallian Inefficiency - International ...
Reverse-Share-Tenancy and Marshallian Inefficiency - International ...

Create successful ePaper yourself
Turn your PDF publications into a flip-book with our unique Google optimized e-Paper software.
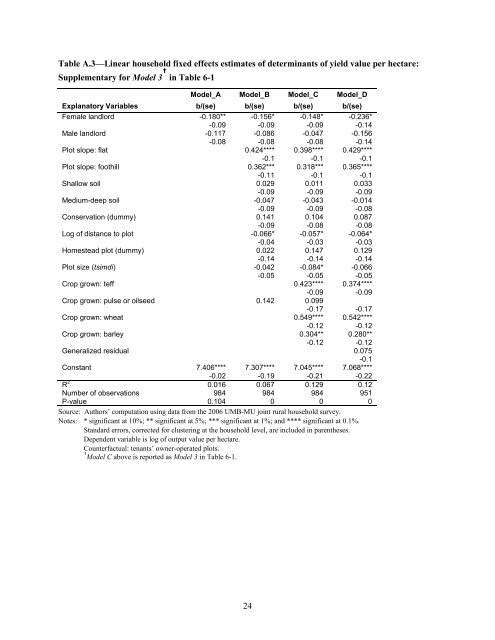
Table A.3—Linear household fixed effects estimates of determinants of yield value per hectare:<br />
Supplementary for Model 3 † in Table 6-1<br />
Model_A Model_B Model_C Model_D<br />
Explanatory Variables b/(se) b/(se) b/(se) b/(se)<br />
Female l<strong>and</strong>lord -0.180** -0.156* -0.148* -0.236*<br />
-0.09 -0.09 -0.09 -0.14<br />
Male l<strong>and</strong>lord -0.117 -0.086 -0.047 -0.156<br />
-0.08 -0.08 -0.08 -0.14<br />
Plot slope: flat 0.424**** 0.398**** 0.429****<br />
-0.1 -0.1 -0.1<br />
Plot slope: foothill 0.362*** 0.318*** 0.365****<br />
-0.11 -0.1 -0.1<br />
Shallow soil 0.029 0.011 0.033<br />
-0.09 -0.09 -0.09<br />
Medium-deep soil -0.047 -0.043 -0.014<br />
-0.09 -0.09 -0.08<br />
Conservation (dummy) 0.141 0.104 0.087<br />
-0.09 -0.08 -0.08<br />
Log of distance to plot -0.066* -0.057* -0.064*<br />
-0.04 -0.03 -0.03<br />
Homestead plot (dummy) 0.022 0.147 0.129<br />
-0.14 -0.14 -0.14<br />
Plot size (tsimdi) -0.042 -0.084* -0.066<br />
-0.05 -0.05 -0.05<br />
Crop grown: teff 0.423**** 0.374****<br />
-0.09 -0.09<br />
Crop grown: pulse or oilseed 0.142 0.099<br />
-0.17 -0.17<br />
Crop grown: wheat 0.549**** 0.542****<br />
-0.12 -0.12<br />
Crop grown: barley 0.304** 0.280**<br />
-0.12 -0.12<br />
Generalized residual 0.075<br />
-0.1<br />
Constant 7.406**** 7.307**** 7.045**** 7.068****<br />
-0.02 -0.19 -0.21 -0.22<br />
R 2 0.016 0.067 0.129 0.12<br />
Number of observations 984 984 984 951<br />
P-value 0.104 0 0 0<br />
Source: Authors’ computation using data from the 2006 UMB-MU joint rural household survey.<br />
Notes: * significant at 10%; ** significant at 5%; *** significant at 1%; <strong>and</strong> **** significant at 0.1%.<br />
St<strong>and</strong>ard errors, corrected for clustering at the household level, are included in parentheses.<br />
Dependent variable is log of output value per hectare.<br />
Counterfactual: tenants’ owner-operated plots.<br />
† Model C above is reported as Model 3 in Table 6-1.<br />
24


