

Reverse-Share-Tenancy and Marshallian Inefficiency - International ...
Reverse-Share-Tenancy and Marshallian Inefficiency - International ...
Reverse-Share-Tenancy and Marshallian Inefficiency - International ...

Create successful ePaper yourself
Turn your PDF publications into a flip-book with our unique Google optimized e-Paper software.
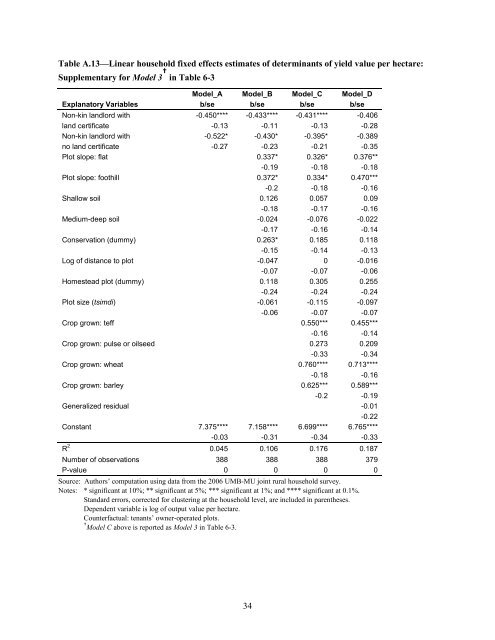
Table A.13—Linear household fixed effects estimates of determinants of yield value per hectare:<br />
Supplementary for Model 3 † in Table 6-3<br />
Model_A Model_B Model_C Model_D<br />
Explanatory Variables b/se b/se b/se b/se<br />
Non-kin l<strong>and</strong>lord with -0.450**** -0.433**** -0.431**** -0.406<br />
l<strong>and</strong> certificate -0.13 -0.11 -0.13 -0.28<br />
Non-kin l<strong>and</strong>lord with -0.522* -0.430* -0.395* -0.389<br />
no l<strong>and</strong> certificate -0.27 -0.23 -0.21 -0.35<br />
Plot slope: flat 0.337* 0.326* 0.376**<br />
-0.19 -0.18 -0.18<br />
Plot slope: foothill 0.372* 0.334* 0.470***<br />
-0.2 -0.18 -0.16<br />
Shallow soil 0.126 0.057 0.09<br />
-0.18 -0.17 -0.16<br />
Medium-deep soil -0.024 -0.076 -0.022<br />
-0.17 -0.16 -0.14<br />
Conservation (dummy) 0.263* 0.185 0.118<br />
-0.15 -0.14 -0.13<br />
Log of distance to plot -0.047 0 -0.016<br />
-0.07 -0.07 -0.06<br />
Homestead plot (dummy) 0.118 0.305 0.255<br />
-0.24 -0.24 -0.24<br />
Plot size (tsimdi) -0.061 -0.115 -0.097<br />
-0.06 -0.07 -0.07<br />
Crop grown: teff 0.550*** 0.455***<br />
-0.16 -0.14<br />
Crop grown: pulse or oilseed 0.273 0.209<br />
-0.33 -0.34<br />
Crop grown: wheat 0.760**** 0.713****<br />
-0.18 -0.16<br />
Crop grown: barley 0.625*** 0.589***<br />
-0.2 -0.19<br />
Generalized residual -0.01<br />
-0.22<br />
Constant 7.375**** 7.158**** 6.699**** 6.765****<br />
-0.03 -0.31 -0.34 -0.33<br />
R 2 0.045 0.106 0.176 0.187<br />
Number of observations 388 388 388 379<br />
P-value 0 0 0 0<br />
Source: Authors’ computation using data from the 2006 UMB-MU joint rural household survey.<br />
Notes: * significant at 10%; ** significant at 5%; *** significant at 1%; <strong>and</strong> **** significant at 0.1%.<br />
St<strong>and</strong>ard errors, corrected for clustering at the household level, are included in parentheses.<br />
Dependent variable is log of output value per hectare.<br />
Counterfactual: tenants’ owner-operated plots.<br />
† Model C above is reported as Model 3 in Table 6-3.<br />
34


