

Reverse-Share-Tenancy and Marshallian Inefficiency - International ...
Reverse-Share-Tenancy and Marshallian Inefficiency - International ...
Reverse-Share-Tenancy and Marshallian Inefficiency - International ...

You also want an ePaper? Increase the reach of your titles
YUMPU automatically turns print PDFs into web optimized ePapers that Google loves.
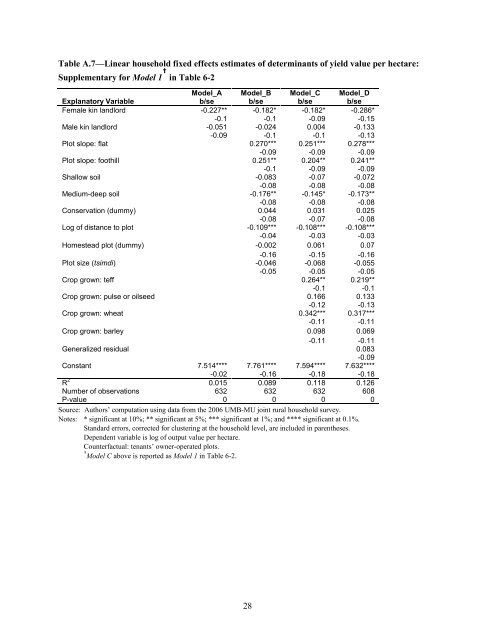
Table A.7—Linear household fixed effects estimates of determinants of yield value per hectare:<br />
Supplementary for Model 1 † in Table 6-2<br />
Model_A Model_B Model_C Model_D<br />
Explanatory Variable b/se b/se b/se b/se<br />
Female kin l<strong>and</strong>lord -0.227** -0.182* -0.182* -0.286*<br />
-0.1 -0.1 -0.09 -0.15<br />
Male kin l<strong>and</strong>lord -0.051 -0.024 0.004 -0.133<br />
-0.09 -0.1 -0.1 -0.13<br />
Plot slope: flat 0.270*** 0.251*** 0.278***<br />
-0.09 -0.09 -0.09<br />
Plot slope: foothill 0.251** 0.204** 0.241**<br />
-0.1 -0.09 -0.09<br />
Shallow soil -0.083 -0.07 -0.072<br />
-0.08 -0.08 -0.08<br />
Medium-deep soil -0.176** -0.145* -0.173**<br />
-0.08 -0.08 -0.08<br />
Conservation (dummy) 0.044 0.031 0.025<br />
-0.08 -0.07 -0.08<br />
Log of distance to plot -0.109*** -0.108*** -0.108***<br />
-0.04 -0.03 -0.03<br />
Homestead plot (dummy) -0.002 0.061 0.07<br />
-0.16 -0.15 -0.16<br />
Plot size (tsimdi) -0.046 -0.068 -0.055<br />
-0.05 -0.05 -0.05<br />
Crop grown: teff 0.264** 0.219**<br />
-0.1 -0.1<br />
Crop grown: pulse or oilseed 0.166 0.133<br />
-0.12 -0.13<br />
Crop grown: wheat 0.342*** 0.317***<br />
-0.11 -0.11<br />
Crop grown: barley 0.098 0.069<br />
-0.11 -0.11<br />
Generalized residual 0.083<br />
-0.09<br />
Constant 7.514**** 7.761**** 7.594**** 7.632****<br />
-0.02 -0.16 -0.18 -0.18<br />
R 2 0.015 0.089 0.118 0.126<br />
Number of observations 632 632 632 608<br />
P-value 0 0 0 0<br />
Source: Authors’ computation using data from the 2006 UMB-MU joint rural household survey.<br />
Notes: * significant at 10%; ** significant at 5%; *** significant at 1%; <strong>and</strong> **** significant at 0.1%.<br />
St<strong>and</strong>ard errors, corrected for clustering at the household level, are included in parentheses.<br />
Dependent variable is log of output value per hectare.<br />
Counterfactual: tenants’ owner-operated plots.<br />
† Model C above is reported as Model 1 in Table 6-2.<br />
28


