

Reverse-Share-Tenancy and Marshallian Inefficiency - International ...
Reverse-Share-Tenancy and Marshallian Inefficiency - International ...
Reverse-Share-Tenancy and Marshallian Inefficiency - International ...

You also want an ePaper? Increase the reach of your titles
YUMPU automatically turns print PDFs into web optimized ePapers that Google loves.
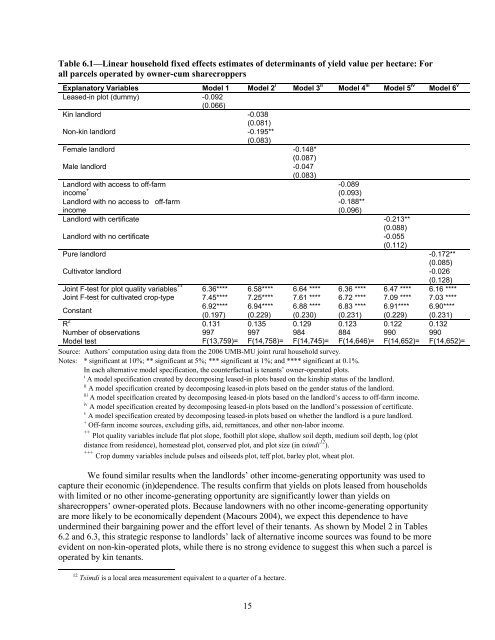
Table 6.1—Linear household fixed effects estimates of determinants of yield value per hectare: For<br />
all parcels operated by owner-cum sharecroppers<br />
Explanatory Variables Model 1 Model 2 i Model 3 ii Model 4 iii Model 5 iv Model 6 v<br />
Leased-in plot (dummy) -0.092<br />
(0.066)<br />
Kin l<strong>and</strong>lord -0.038<br />
(0.081)<br />
Non-kin l<strong>and</strong>lord -0.195**<br />
(0.083)<br />
Female l<strong>and</strong>lord -0.148*<br />
(0.087)<br />
Male l<strong>and</strong>lord -0.047<br />
(0.083)<br />
L<strong>and</strong>lord with access to off-farm<br />
income + -0.089<br />
(0.093)<br />
L<strong>and</strong>lord with no access to off-farm<br />
income<br />
-0.188**<br />
(0.096)<br />
L<strong>and</strong>lord with certificate -0.213**<br />
(0.088)<br />
L<strong>and</strong>lord with no certificate -0.055<br />
(0.112)<br />
Pure l<strong>and</strong>lord -0.172**<br />
(0.085)<br />
Cultivator l<strong>and</strong>lord -0.026<br />
(0.128)<br />
Joint F-test for plot quality variables ++ 6.36**** 6.58**** 6.64 **** 6.36 **** 6.47 **** 6.16 ****<br />
Joint F-test for cultivated crop-type<br />
+++<br />
Constant<br />
7.45**** 7.25**** 7.61 **** 6.72 **** 7.09 **** 7.03 ****<br />
6.92**** 6.94**** 6.88 **** 6.83 **** 6.91**** 6.90****<br />
(0.197) (0.229) (0.230) (0.231) (0.229) (0.231)<br />
R 2 0.131 0.135 0.129 0.123 0.122 0.132<br />
Number of observations 997 997 984 884 990 990<br />
Model test F(13,759)= F(14,758)= F(14,745)= F(14,646)= F(14,652)= F(14,652)=<br />
Source: Authors’ computation using data from the 2006 UMB-MU joint rural household survey.<br />
Notes: * significant at 10%; ** significant at 5%; *** significant at 1%; <strong>and</strong> **** significant at 0.1%.<br />
In each alternative model specification, the counterfactual is tenants’ owner-operated plots.<br />
i A model specification created by decomposing leased-in plots based on the kinship status of the l<strong>and</strong>lord.<br />
ii A model specification created by decomposing leased-in plots based on the gender status of the l<strong>and</strong>lord.<br />
iii A model specification created by decomposing leased-in plots based on the l<strong>and</strong>lord’s access to off-farm income.<br />
iv A model specification created by decomposing leased-in plots based on the l<strong>and</strong>lord’s possession of certificate.<br />
v A model specification created by decomposing leased-in plots based on whether the l<strong>and</strong>lord is a pure l<strong>and</strong>lord.<br />
+ Off-farm income sources, excluding gifts, aid, remittances, <strong>and</strong> other non-labor income.<br />
++ Plot quality variables include flat plot slope, foothill plot slope, shallow soil depth, medium soil depth, log (plot<br />
distance from residence), homestead plot, conserved plot, <strong>and</strong> plot size (in tsimdi 12 ).<br />
+++ Crop dummy variables include pulses <strong>and</strong> oilseeds plot, teff plot, barley plot, wheat plot.<br />
We found similar results when the l<strong>and</strong>lords’ other income-generating opportunity was used to<br />
capture their economic (in)dependence. The results confirm that yields on plots leased from households<br />
with limited or no other income-generating opportunity are significantly lower than yields on<br />
sharecroppers’ owner-operated plots. Because l<strong>and</strong>owners with no other income-generating opportunity<br />
are more likely to be economically dependent (Macours 2004), we expect this dependence to have<br />
undermined their bargaining power <strong>and</strong> the effort level of their tenants. As shown by Model 2 in Tables<br />
6.2 <strong>and</strong> 6.3, this strategic response to l<strong>and</strong>lords’ lack of alternative income sources was found to be more<br />
evident on non-kin-operated plots, while there is no strong evidence to suggest this when such a parcel is<br />
operated by kin tenants.<br />
12 Tsimdi is a local area measurement equivalent to a quarter of a hectare.<br />
15


