

2010 Progress Report - International Joint Commission
2010 Progress Report - International Joint Commission
2010 Progress Report - International Joint Commission

You also want an ePaper? Increase the reach of your titles
YUMPU automatically turns print PDFs into web optimized ePapers that Google loves.
<strong>Progress</strong> <strong>Report</strong> <strong>2010</strong><br />
the total allowances allocated each year must not<br />
exceed the national cap. Every year, each individual<br />
source must hold enough allowances to cover its<br />
annual emissions. Unused allowances can be sold<br />
(traded) or banked (saved) for future use. The<br />
banking of allowances gives sources the fl exibility<br />
to determine how they will comply with program<br />
requirements over time.<br />
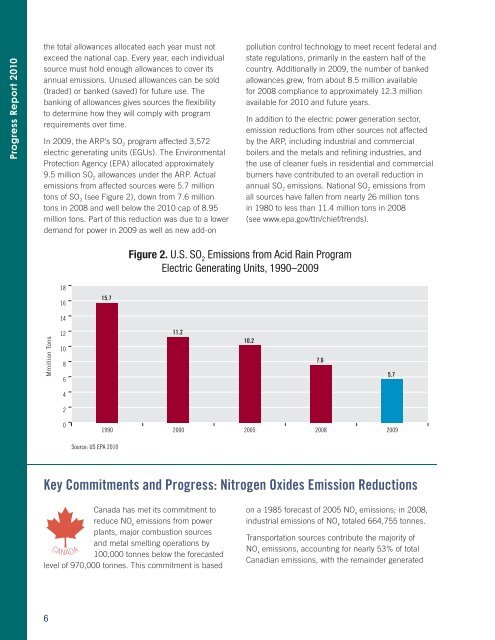
In 2009, the ARP’s SO 2<br />
program affected 3,572<br />
electric generating units (EGUs). The Environmental<br />
Protection Agency (EPA) allocated approximately<br />
9.5 million SO 2<br />
allowances under the ARP. Actual<br />
emissions from affected sources were 5.7 million<br />
tons of SO 2<br />
(see Figure 2), down from 7.6 million<br />
tons in 2008 and well below the <strong>2010</strong> cap of 8.95<br />
million tons. Part of this reduction was due to a lower<br />
demand for power in 2009 as well as new add-on<br />
pollution control technology to meet recent federal and<br />
state regulations, primarily in the eastern half of the<br />
country. Additionally in 2009, the number of banked<br />
allowances grew, from about 8.5 million available<br />
for 2008 compliance to approximately 12.3 million<br />
available for <strong>2010</strong> and future years.<br />
In addition to the electric power generation sector,<br />
emission reductions from other sources not affected<br />
by the ARP, including industrial and commercial<br />
boilers and the metals and refi ning industries, and<br />
the use of cleaner fuels in residential and commercial<br />
burners have contributed to an overall reduction in<br />
annual SO 2<br />
emissions. National SO 2<br />
emissions from<br />
all sources have fallen from nearly 26 million tons<br />
in 1980 to less than 11.4 million tons in 2008<br />
(see www.epa.gov/ttn/chief/trends).<br />
Figure 2. U.S. SO 2<br />
Emissions from Acid Rain Program<br />
Electric Generating Units, 1990–2009<br />
18<br />
16<br />
15.7<br />
14<br />
Mmillion Tons<br />
12<br />
10<br />
8<br />
6<br />
11.2<br />
10.2<br />
7.6<br />
5.7<br />
4<br />
2<br />
0<br />
1990 2000 2005 2008 2009<br />
Source: US EPA <strong>2010</strong><br />
Key Commitments and <strong>Progress</strong>: Nitrogen Oxides Emission Reductions<br />
Canada has met its commitment to<br />
reduce NO x<br />
emissions from power<br />
plants, major combustion sources<br />
and metal smelting operations by<br />
100,000 tonnes below the forecasted<br />
level of 970,000 tonnes. This commitment is based<br />
CANADA<br />
on a 1985 forecast of 2005 NO x<br />
emissions; in 2008,<br />
industrial emissions of NO x<br />
totaled 664,755 tonnes.<br />
Transportation sources contribute the majority of<br />
NO x<br />
emissions, accounting for nearly 53% of total<br />
Canadian emissions, with the remainder generated<br />
6


