

2010 Progress Report - International Joint Commission
2010 Progress Report - International Joint Commission
2010 Progress Report - International Joint Commission

Create successful ePaper yourself
Turn your PDF publications into a flip-book with our unique Google optimized e-Paper software.
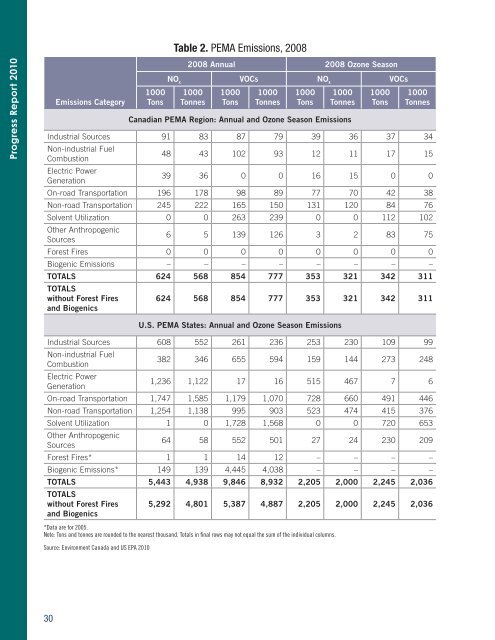
Table 2. PEMA Emissions, 2008<br />
<strong>Progress</strong> <strong>Report</strong> <strong>2010</strong><br />
Emissions Category<br />
1000<br />
Tons<br />
2008 Annual 2008 Ozone Season<br />
NO x<br />
VOCs NO x<br />
VOCs<br />
1000<br />
Tonnes<br />
1000<br />
Tons<br />
1000<br />
Tonnes<br />
1000<br />
Tons<br />
1000<br />
Tonnes<br />
Canadian PEMA Region: Annual and Ozone Season Emissions<br />
1000<br />
Tons<br />
1000<br />
Tonnes<br />
Industrial Sources 91 83 87 79 39 36 37 34<br />
Non-industrial Fuel<br />
Combustion<br />
48 43 102 93 12 11 17 15<br />
Electric Power<br />
Generation<br />
39 36 0 0 16 15 0 0<br />
On-road Transportation 196 178 98 89 77 70 42 38<br />
Non-road Transportation 245 222 165 150 131 120 84 76<br />
Solvent Utilization 0 0 263 239 0 0 112 102<br />
Other Anthropogenic<br />
Sources<br />
6 5 139 126 3 2 83 75<br />
Forest Fires 0 0 0 0 0 0 0 0<br />
Biogenic Emissions – – – – – – – –<br />
TOTALS 624 568 854 777 353 321 342 311<br />
TOTALS<br />
without Forest Fires<br />
and Biogenics<br />
624 568 854 777 353 321 342 311<br />
U.S. PEMA States: Annual and Ozone Season Emissions<br />
Industrial Sources 608 552 261 236 253 230 109 99<br />
Non-industrial Fuel<br />
Combustion<br />
382 346 655 594 159 144 273 248<br />
Electric Power<br />
Generation<br />
1,236 1,122 17 16 515 467 7 6<br />
On-road Transportation 1,747 1,585 1,179 1,070 728 660 491 446<br />
Non-road Transportation 1,254 1,138 995 903 523 474 415 376<br />
Solvent Utilization 1 0 1,728 1,568 0 0 720 653<br />
Other Anthropogenic<br />
Sources<br />
64 58 552 501 27 24 230 209<br />
Forest Fires* 1 1 14 12 – – – –<br />
Biogenic Emissions* 149 139 4,445 4,038 – – – –<br />
TOTALS 5,443 4,938 9,846 8,932 2,205 2,000 2,245 2,036<br />
TOTALS<br />
without Forest Fires<br />
and Biogenics<br />
5,292 4,801 5,387 4,887 2,205 2,000 2,245 2,036<br />
*Data are for 2005.<br />
Note: Tons and tonnes are rounded to the nearest thousand. Totals in final rows may not equal the sum of the individual columns.<br />
Source: Environment Canada and US EPA <strong>2010</strong><br />
30


