

2010 Progress Report - International Joint Commission
2010 Progress Report - International Joint Commission
2010 Progress Report - International Joint Commission

Create successful ePaper yourself
Turn your PDF publications into a flip-book with our unique Google optimized e-Paper software.
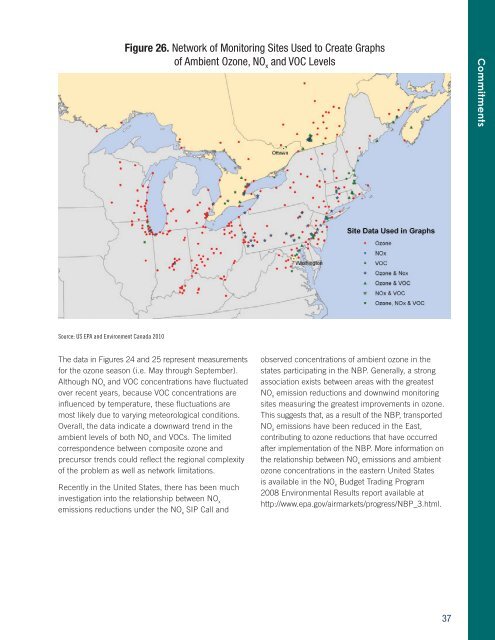
Figure 26. Network of Monitoring Sites Used to Create Graphs<br />
of Ambient Ozone, NO x<br />
and VOC Levels<br />
Commitments<br />
Source: US EPA and Environment Canada <strong>2010</strong><br />
The data in Figures 24 and 25 represent measurements<br />
for the ozone season (i.e. May through September).<br />
Although NO x<br />
and VOC concentrations have fl uctuated<br />
over recent years, because VOC concentrations are<br />
infl uenced by temperature, these fl uctuations are<br />
most likely due to varying meteorological conditions.<br />
Overall, the data indicate a downward trend in the<br />
ambient levels of both NO x<br />
and VOCs. The limited<br />
correspondence between composite ozone and<br />
precursor trends could refl ect the regional complexity<br />
of the problem as well as network limitations.<br />
Recently in the United States, there has been much<br />
investigation into the relationship between NO x<br />
emissions reductions under the NO x<br />
SIP Call and<br />
observed concentrations of ambient ozone in the<br />
states participating in the NBP. Generally, a strong<br />
association exists between areas with the greatest<br />
NO x<br />
emission reductions and downwind monitoring<br />
sites measuring the greatest improvements in ozone.<br />
This suggests that, as a result of the NBP, transported<br />
NO x<br />
emissions have been reduced in the East,<br />
contributing to ozone reductions that have occurred<br />
after implementation of the NBP. More information on<br />
the relationship between NO x<br />
emissions and ambient<br />
ozone concentrations in the eastern United States<br />
is available in the NO x<br />
Budget Trading Program<br />
2008 Environmental Results report available at<br />
http://www.epa.gov/airmarkets/progress/NBP_3.html.<br />
37


