

2010 Progress Report - International Joint Commission
2010 Progress Report - International Joint Commission
2010 Progress Report - International Joint Commission

You also want an ePaper? Increase the reach of your titles
YUMPU automatically turns print PDFs into web optimized ePapers that Google loves.
<strong>Progress</strong> <strong>Report</strong> <strong>2010</strong><br />
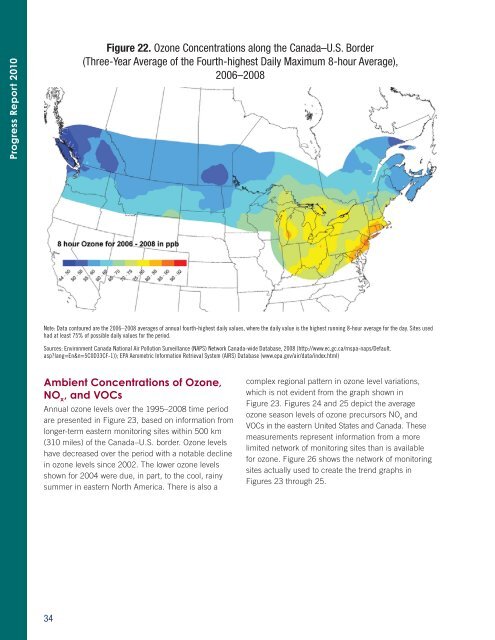
Figure 22. Ozone Concentrations along the Canada–U.S. Border<br />
(Three-Year Average of the Fourth-highest Daily Maximum 8-hour Average),<br />
2006–2008<br />
Note: Data contoured are the 2006–2008 averages of annual fourth-highest daily values, where the daily value is the highest running 8-hour average for the day. Sites used<br />
had at least 75% of possible daily values for the period.<br />
Sources: Environment Canada National Air Pollution Surveillance (NAPS) Network Canada-wide Database, 2008 (http://www.ec.gc.ca/rnspa-naps/Default.<br />
asp?lang=En&n=5C0D33CF-1)); EPA Aerometric Information Retrieval System (AIRS) Database (www.epa.gov/air/data/index.html)<br />
Ambient Concentrations of Ozone,<br />
NO x<br />
, and VOCs<br />
Annual ozone levels over the 1995–2008 time period<br />
are presented in Figure 23, based on information from<br />
longer-term eastern monitoring sites within 500 km<br />
(310 miles) of the Canada–U.S. border. Ozone levels<br />
have decreased over the period with a notable decline<br />
in ozone levels since 2002. The lower ozone levels<br />
shown for 2004 were due, in part, to the cool, rainy<br />
summer in eastern North America. There is also a<br />
complex regional pattern in ozone level variations,<br />
which is not evident from the graph shown in<br />
Figure 23. Figures 24 and 25 depict the average<br />
ozone season levels of ozone precursors NO x<br />
and<br />
VOCs in the eastern United States and Canada. These<br />
measurements represent information from a more<br />
limited network of monitoring sites than is available<br />
for ozone. Figure 26 shows the network of monitoring<br />
sites actually used to create the trend graphs in<br />
Figures 23 through 25.<br />
34


