

2010 Progress Report - International Joint Commission
2010 Progress Report - International Joint Commission
2010 Progress Report - International Joint Commission

You also want an ePaper? Increase the reach of your titles
YUMPU automatically turns print PDFs into web optimized ePapers that Google loves.
<strong>Progress</strong> <strong>Report</strong> <strong>2010</strong><br />
refueling, residential wood combustion, vehicle<br />
inspection and maintenance, reformulated gasoline,<br />
cement kilns, internal combustion engines, large<br />
non-utility boilers and gas turbines, fossil fuel-fi red<br />
utility boilers, and additional measures needed to<br />
attain the NAAQS.<br />
Quantitative NO x<br />
and VOC<br />
Emission Reductions<br />
In the Ozone Annex, the United States provided NO x<br />
and VOC emission reduction estimates associated<br />
with the application of the control strategies identifi ed<br />
under Part III B and Part IV of the Annex. The EPA<br />
has updated these estimates using national data sets<br />
that were completed in late 2007.<br />
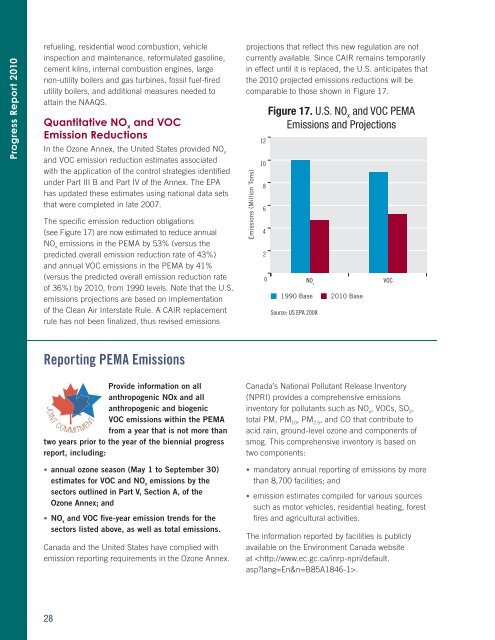
The specifi c emission reduction obligations<br />
(see Figure 17) are now estimated to reduce annual<br />
NO x<br />
emissions in the PEMA by 53% (versus the<br />
predicted overall emission reduction rate of 43%)<br />
and annual VOC emissions in the PEMA by 41%<br />
(versus the predicted overall emission reduction rate<br />
of 36%) by <strong>2010</strong>, from 1990 levels. Note that the U.S.<br />
emissions projections are based on implementation<br />
of the Clean Air Interstate Rule. A CAIR replacement<br />
rule has not been fi nalized, thus revised emissions<br />
projections that refl ect this new regulation are not<br />
currently available. Since CAIR remains temporarily<br />
in effect until it is replaced, the U.S. anticipates that<br />
the <strong>2010</strong> projected emissions reductions will be<br />
comparable to those shown in Figure 17.<br />
Emissions (Million Tons)<br />
12<br />
10<br />
8<br />
6<br />
4<br />
2<br />
0<br />
Figure 17. U.S. NO x<br />
and VOC PEMA<br />
Emissions and Projections<br />
NO x<br />
1990 Base <strong>2010</strong> Base<br />
Source: US EPA 2008<br />
VOC<br />
<strong>Report</strong>ing PEMA Emissions<br />
Provide information on all<br />
anthropogenic NOx and all<br />
anthropogenic and biogenic<br />
VOC emissions within the PEMA<br />
from a year that is not more than<br />
two years prior to the year of the biennial progress<br />
report, including:<br />
JOINT COMMITMENT<br />
• annual ozone season (May 1 to September 30)<br />
estimates for VOC and NO x<br />
emissions by the<br />
sectors outlined in Part V, Section A, of the<br />
Ozone Annex; and<br />
• NO x<br />
and VOC five-year emission trends for the<br />
sectors listed above, as well as total emissions.<br />
Canada and the United States have complied with<br />
emission reporting requirements in the Ozone Annex.<br />
Canada’s National Pollutant Release Inventory<br />
(NPRI) provides a comprehensive emissions<br />
inventory for pollutants such as NO x<br />
, VOCs, SO 2<br />
,<br />
total PM, PM 10<br />
, PM 2.5<br />
, and CO that contribute to<br />
acid rain, ground-level ozone and components of<br />
smog. This comprehensive inventory is based on<br />
two components:<br />
• mandatory annual reporting of emissions by more<br />
than 8,700 facilities; and<br />
• emission estimates compiled for various sources<br />
such as motor vehicles, residential heating, forest<br />
fi res and agricultural activities.<br />
The information reported by facilities is publicly<br />
available on the Environment Canada website<br />
at .<br />
28


