Waste not want not - States Assembly
Waste not want not - States Assembly
Waste not want not - States Assembly

Create successful ePaper yourself
Turn your PDF publications into a flip-book with our unique Google optimized e-Paper software.
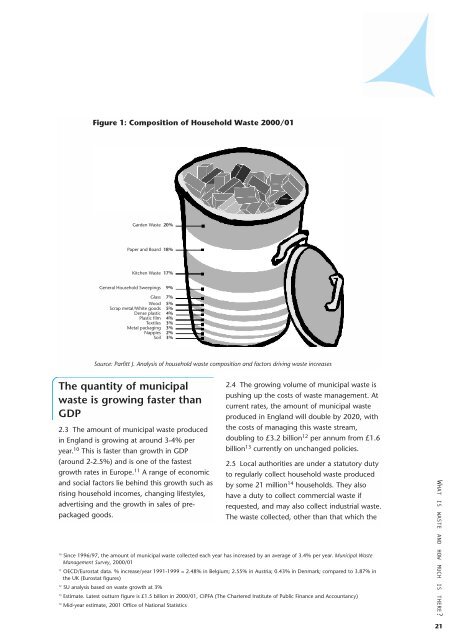
Figure 1: Composition of Household <strong>Waste</strong> 2000/01<br />
Garden <strong>Waste</strong> 20%<br />
Paper and Board 18%<br />
Kitchen <strong>Waste</strong> 17%<br />
General Household Sweepings 9%<br />
Glass 7%<br />
Wood 5%<br />
Scrap metal/White goods 5%<br />
Dense plastic 4%<br />
Plastic film 4%<br />
Textiles 3%<br />
Metal packaging 3%<br />
Nappies 2%<br />
Soil 3%<br />
Source: Parfitt J. Analysis of household waste composition and factors driving waste increases<br />
The quantity of municipal<br />
waste is growing faster than<br />
GDP<br />
2.3 The amount of municipal waste produced<br />
in England is growing at around 3-4% per<br />
year. 10 This is faster than growth in GDP<br />
(around 2-2.5%) and is one of the fastest<br />
growth rates in Europe. 11 A range of economic<br />
and social factors lie behind this growth such as<br />
rising household incomes, changing lifestyles,<br />
advertising and the growth in sales of prepackaged<br />
goods.<br />
2.4 The growing volume of municipal waste is<br />
pushing up the costs of waste management. At<br />
current rates, the amount of municipal waste<br />
produced in England will double by 2020, with<br />
the costs of managing this waste stream,<br />
doubling to £3.2 billion 12 per annum from £1.6<br />
billion 13 currently on unchanged policies.<br />
2.5 Local authorities are under a statutory duty<br />
to regularly collect household waste produced<br />
by some 21 million 14 households. They also<br />
have a duty to collect commercial waste if<br />
requested, and may also collect industrial waste.<br />
The waste collected, other than that which the<br />
10<br />
Since 1996/97, the amount of municipal waste collected each year has increased by an average of 3.4% per year. Municipal <strong>Waste</strong><br />
Management Survey, 2000/01<br />
11<br />
OECD/Eurostat data. % increase/year 1991-1999 = 2.48% in Belgium; 2.55% in Austria; 0.43% in Denmark; compared to 3.87% in<br />
the UK (Eurostat figures)<br />
12<br />
SU analysis based on waste growth at 3%<br />
13<br />
Estimate. Latest outturn figure is £1.5 billion in 2000/01, CIPFA (The Chartered Institute of Public Finance and Accountancy)<br />
14<br />
Mid-year estimate, 2001 Office of National Statistics<br />
WHAT IS WASTE AND HOW MUCH IS THERE?<br />
21