Waste not want not - States Assembly
Waste not want not - States Assembly
Waste not want not - States Assembly

Create successful ePaper yourself
Turn your PDF publications into a flip-book with our unique Google optimized e-Paper software.
Current policies are failing to<br />
tackle rising waste quantities<br />
or to reduce the quantity of<br />
waste going to landfill sites<br />
3.7 Successive governments have recognised<br />
the need to move to more sustainable forms of<br />
waste management. Governments have<br />
responded to this challenge by producing<br />
framework strategies within which they have set<br />
targets to move away from landfill and deliver<br />
higher rates of recycling. Until <strong>Waste</strong> Strategy<br />
2000, the targets were aspirational (and remain<br />
so for non-municipal streams). However, in the<br />
absence of a coherent mix of policy and<br />
delivery instruments, successive targets have<br />
<strong>not</strong> been met:<br />
●<br />
●<br />
●<br />
1990 – The Environment White Paper 24 – set<br />
a target of 25% recycling by 2000. This has<br />
<strong>not</strong> been met;<br />
1995 – “Making <strong>Waste</strong> Work” 25 – the<br />
recycling and composting rate for household<br />
waste stood at 6%. This document reemphasised<br />
the need to meet the 25% target<br />
by 2000;<br />
1999 – “A Way with <strong>Waste</strong>” 26 – recognised<br />
that the 25% recycling/composting target<br />
would <strong>not</strong> be met by 2000;<br />
<strong>Waste</strong> Strategy 2000 also set a target of 25%<br />
of household waste to be recycled/composted<br />
by 2005/6. On current progress it will be<br />
very difficult to achieve this.<br />
3.8 England spends about 60% of the EU<br />
average on waste management and disposal<br />
(i.e. around 0.5% of GDP in the UK versus 1.0%<br />
in the Netherlands) 29 and around 40% of those<br />
at the leading edge of waste management<br />
(Figure 4). Because of England’s reliance on<br />
landfill, householders pay some of the lowest<br />
rates for waste collection and disposal in Europe<br />
– around £50 per year on average, 30 which is<br />
roughly half the EU average and about 30% of<br />
the rate of high performing countries. England’s<br />
lower spend on waste per capita reflects both<br />
the relative cheapness and the efficiency of<br />
landfill. However, while some landfill will<br />
justifiably continue to provide a disposal route<br />
for certain wastes, 31 England’s current overreliance<br />
on this form of waste disposal means<br />
that significant environmental impacts are <strong>not</strong><br />
being captured in what households pay. The UK<br />
has the same population as France and the<br />
same GDP, but spends 50% less on municipal<br />
waste management; France diverts 150% more<br />
municipal solid waste from landfill than the UK. 32<br />
●<br />
2000 – <strong>Waste</strong> Strategy 2000 27 – set targets of<br />
recycling or composting 17% of the<br />
household waste stream by 2003/4. This was<br />
translated into statutory targets for each local<br />
authority. This is unlikely to be met as<br />
performance in 2001/2 was under 12%. 28<br />
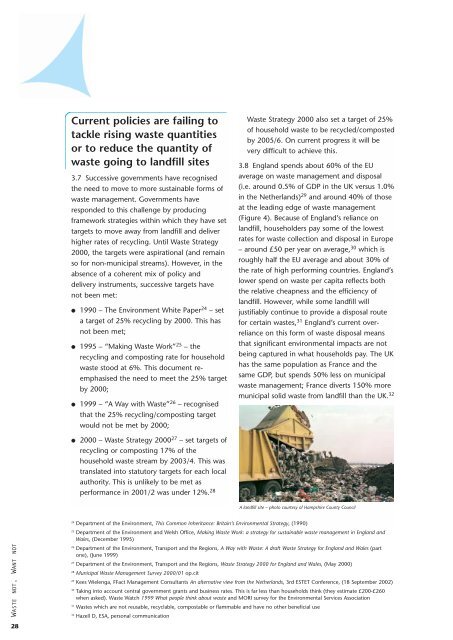
A landfill site – photo courtesy of Hampshire County Council<br />
24<br />
Department of the Environment, This Common Inheritance: Britain’s Environmental Strategy, (1990)<br />
WASTE NOT, WANT NOT<br />
25<br />
Department of the Environment and Welsh Office, Making <strong>Waste</strong> Work: a strategy for sustainable waste management in England and<br />
Wales, (December 1995)<br />
26<br />
Department of the Environment, Transport and the Regions, A Way with <strong>Waste</strong>: A draft <strong>Waste</strong> Strategy for England and Wales (part<br />
one), (June 1999)<br />
27<br />
Department of the Environment, Transport and the Regions, <strong>Waste</strong> Strategy 2000 for England and Wales, (May 2000)<br />
28<br />
Municipal <strong>Waste</strong> Management Survey 2000/01 op.cit<br />
29<br />
Kees Wielenga, FFact Management Consultants An alternative view from the Netherlands, 3rd ESTET Conference, (18 September 2002)<br />
30<br />
Taking into account central government grants and business rates. This is far less than households think (they estimate £200-£260<br />
when asked). <strong>Waste</strong> Watch 1999 What people think about waste and MORI survey for the Environmental Services Association<br />
31<br />
<strong>Waste</strong>s which are <strong>not</strong> reusable, recyclable, compostable or flammable and have no other beneficial use<br />
32<br />
Hazell D, ESA, personal communication<br />
28