

Scania annual report 2003
Scania annual report 2003
Scania annual report 2003

Create successful ePaper yourself
Turn your PDF publications into a flip-book with our unique Google optimized e-Paper software.
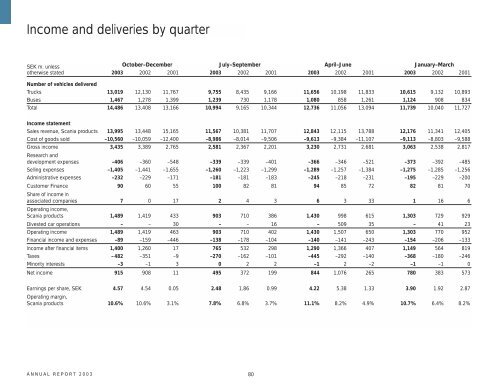
Income and deliveries by quarter<br />
SEK m. unless October–December July–September April–June January–March<br />
otherwise stated <strong>2003</strong> 2002 2001 <strong>2003</strong> 2002 2001 <strong>2003</strong> 2002 2001 <strong>2003</strong> 2002 2001<br />
Number of vehicles delivered<br />
Trucks 13,019 12,130 11,767 9,755 8,435 9,166 11,656 10,198 11,833 10,615 9,132 10,893<br />
Buses 1,467 1,278 1,399 1,239 730 1,178 1,080 858 1,261 1,124 908 834<br />
Total 14,486 13,408 13,166 10,994 9,165 10,344 12,736 11,056 13,094 11,739 10,040 11,727<br />
Income statement<br />
Sales revenue, <strong>Scania</strong> products 13,995 13,448 15,165 11,567 10,381 11,707 12,843 12,115 13,788 12,176 11,341 12,405<br />
Cost of goods sold –10,560 –10,059 –12,400 –8,986 –8,014 –9,506 –9,613 –9,384 –11,107 –9,113 –8,803 –9,588<br />
Gross income 3,435 3,389 2,765 2,581 2,367 2,201 3,230 2,731 2,681 3,063 2,538 2,817<br />
Research and<br />
development expenses –406 –360 –548 –339 –339 –401 –366 –346 –521 –373 –392 –485<br />
Selling expenses –1,405 –1,441 –1,655 –1,260 –1,223 –1,299 –1,289 –1,257 –1,384 –1,275 –1,285 –1,256<br />
Administrative expenses –232 –229 –171 –181 –181 –183 –245 –218 –231 –195 –229 –200<br />
Customer Finance 90 60 55 100 82 81 94 85 72 82 81 70<br />
Share of income in<br />
associated companies 7 0 17 2 4 3 6 3 33 1 16 6<br />
Operating income,<br />
<strong>Scania</strong> products 1,489 1,419 433 903 710 386 1,430 998 615 1,303 729 929<br />
Divested car operations – – 30 – – 16 – 509 35 – 41 23<br />
Operating income 1,489 1,419 463 903 710 402 1,430 1,507 650 1,303 770 952<br />
Financial income and expenses –89 –159 –446 –138 –178 –104 –140 –141 –243 –154 –206 –133<br />
Income after financial items 1,400 1,260 17 765 532 298 1,290 1,366 407 1,149 564 819<br />
Taxes –482 –351 –9 –270 –162 –101 –445 –292 –140 –368 –180 –246<br />
Minority interests –3 –1 3 0 2 2 –1 2 –2 –1 –1 0<br />
Net income 915 908 11 495 372 199 844 1,076 265 780 383 573<br />
Earnings per share, SEK 4.57 4.54 0.05 2.48 1.86 0.99 4.22 5.38 1.33 3.90 1.92 2.87<br />
Operating margin,<br />
<strong>Scania</strong> products 10.6% 10.6% 3.1% 7.8% 6.8% 3.7% 11.1% 8.2% 4.9% 10.7% 6.4% 8.2%<br />
ANNUAL REPORT <strong>2003</strong><br />
80


