

Scania annual report 2003
Scania annual report 2003
Scania annual report 2003

You also want an ePaper? Increase the reach of your titles
YUMPU automatically turns print PDFs into web optimized ePapers that Google loves.
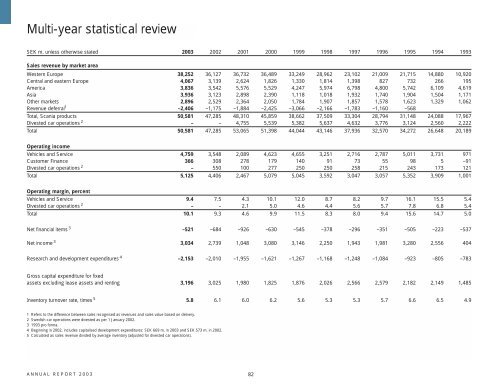
Multi-year statistical review<br />
SEK m. unless otherwise stated <strong>2003</strong> 2002 2001 2000 1999 1998 1997 1996 1995 1994 1993<br />
Sales revenue by market area<br />
Western Europe 38,252 36,127 36,732 36,489 33,249 28,962 23,102 21,009 21,715 14,880 10,920<br />
Central and eastern Europe 4,067 3,139 2,624 1,826 1,330 1,814 1,398 827 732 266 195<br />
America 3,836 3,542 5,576 5,529 4,247 5,974 6,798 4,800 5,742 6,109 4,619<br />
Asia 3,936 3,123 2,898 2,390 1,118 1,018 1,932 1,740 1,904 1,504 1,171<br />
Other markets 2,896 2,529 2,364 2,050 1,784 1,907 1,857 1,578 1,623 1,329 1,062<br />
Revenue deferral 1 –2,406 –1,175 –1,884 –2,425 –3,066 –2,166 –1,783 –1,160 –568<br />
Total, <strong>Scania</strong> products 50,581 47,285 48,310 45,859 38,662 37,509 33,304 28,794 31,148 24,088 17,967<br />
Divested car operations 2 – – 4,755 5,539 5,382 5,637 4,632 3,776 3,124 2,560 2,222<br />
Total 50,581 47,285 53,065 51,398 44,044 43,146 37,936 32,570 34,272 26,648 20,189<br />
Operating income<br />
Vehicles and Service 4,759 3,548 2,089 4,623 4,655 3,251 2,716 2,787 5,011 3,731 971<br />
Customer Finance 366 308 278 179 140 91 73 55 98 5 –91<br />
Divested car operations 2 – 550 100 277 250 250 258 215 243 173 121<br />
Total 5,125 4,406 2,467 5,079 5,045 3,592 3,047 3,057 5,352 3,909 1,001<br />
Operating margin, percent<br />
Vehicles and Service 9.4 7.5 4.3 10.1 12.0 8.7 8.2 9.7 16.1 15.5 5.4<br />
Divested car operations 2 – – 2.1 5.0 4.6 4.4 5.6 5.7 7.8 6.8 5.4<br />
Total 10.1 9.3 4.6 9.9 11.5 8.3 8.0 9.4 15.6 14.7 5.0<br />
Net financial items 3 –521 –684 –926 –630 –545 –378 –296 –351 –505 –223 –537<br />
Net income 3 3,034 2,739 1,048 3,080 3,146 2,250 1,943 1,981 3,280 2,556 404<br />
Research and development expenditures 4 –2,153 –2,010 –1,955 –1,621 –1,267 –1,168 –1,248 –1,084 –923 –805 –783<br />
Gross capital expenditure for fixed<br />
assets excluding lease assets and renting 3,196 3,025 1,980 1,825 1,876 2,026 2,566 2,579 2,182 2,149 1,485<br />
Inventory turnover rate, times 5 5.8 6.1 6.0 6.2 5.6 5.3 5.3 5.7 6.6 6.5 4.9<br />
1 Refers to the difference between sales recognised as revenues and sales value based on delivery.<br />
2 Swedish car operations were divested as per 1 January 2002.<br />
3 1993 pro forma.<br />
4 Beginning in 2002, includes capitalised development expenditures: SEK 669 m. in <strong>2003</strong> and SEK 573 m. in 2002.<br />
5 Calculated as sales revenue divided by average inventory (adjusted for divested car operations).<br />
ANNUAL REPORT <strong>2003</strong><br />
82


