Introduction to Stata 8 - (GRIPS
Introduction to Stata 8 - (GRIPS
Introduction to Stata 8 - (GRIPS

Create successful ePaper yourself
Turn your PDF publications into a flip-book with our unique Google optimized e-Paper software.
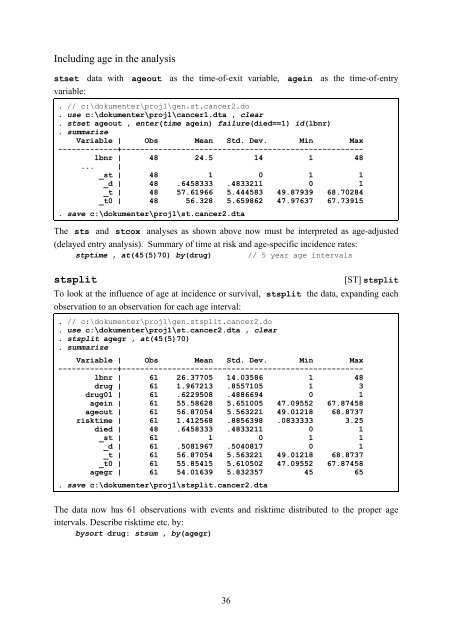
Including age in the analysis<br />
stset data with ageout as the time-of-exit variable, agein as the time-of-entry<br />
variable:<br />
. // c:\dokumenter\proj1\gen.st.cancer2.do<br />
. use c:\dokumenter\proj1\cancer1.dta , clear<br />
. stset ageout , enter(time agein) failure(died==1) id(lbnr)<br />
. summarize<br />
Variable | Obs Mean Std. Dev. Min Max<br />
-------------+-----------------------------------------------------<br />
lbnr | 48 24.5 14 1 48<br />
... |<br />
_st | 48 1 0 1 1<br />
_d | 48 .6458333 .4833211 0 1<br />
_t | 48 57.61966 5.444583 49.87939 68.70284<br />
_t0 | 48 56.328 5.659862 47.97637 67.73915<br />
. save c:\dokumenter\proj1\st.cancer2.dta<br />
The sts and stcox analyses as shown above now must be interpreted as age-adjusted<br />
(delayed entry analysis). Summary of time at risk and age-specific incidence rates:<br />
stptime , at(45(5)70) by(drug) // 5 year age intervals<br />
stsplit<br />
[ST] stsplit<br />
To look at the influence of age at incidence or survival, stsplit the data, expanding each<br />
observation <strong>to</strong> an observation for each age interval:<br />
. // c:\dokumenter\proj1\gen.stsplit.cancer2.do<br />
. use c:\dokumenter\proj1\st.cancer2.dta , clear<br />
. stsplit agegr , at(45(5)70)<br />
. summarize<br />
Variable | Obs Mean Std. Dev. Min Max<br />
-------------+-----------------------------------------------------<br />
lbnr | 61 26.37705 14.03586 1 48<br />
drug | 61 1.967213 .8557105 1 3<br />
drug01 | 61 .6229508 .4886694 0 1<br />
agein | 61 55.58628 5.651005 47.09552 67.87458<br />
ageout | 61 56.87054 5.563221 49.01218 68.8737<br />
risktime | 61 1.412568 .8856398 .0833333 3.25<br />
died | 48 .6458333 .4833211 0 1<br />
_st | 61 1 0 1 1<br />
_d | 61 .5081967 .5040817 0 1<br />
_t | 61 56.87054 5.563221 49.01218 68.8737<br />
_t0 | 61 55.85415 5.610502 47.09552 67.87458<br />
agegr | 61 54.01639 5.832357 45 65<br />
. save c:\dokumenter\proj1\stsplit.cancer2.dta<br />
The data now has 61 observations with events and risktime distributed <strong>to</strong> the proper age<br />
intervals. Describe risktime etc. by:<br />
bysort drug: stsum , by(agegr)<br />
36