Introduction to Stata 8 - (GRIPS
Introduction to Stata 8 - (GRIPS
Introduction to Stata 8 - (GRIPS

Create successful ePaper yourself
Turn your PDF publications into a flip-book with our unique Google optimized e-Paper software.
14.7. Examples<br />
On the following pages you find illustrations of some important graph types, including the<br />
commands that generated the graphs. The appearance is different from the manual's graphs; it<br />
was determined by my schemes lean1 and lean2, described in section 14.9.<br />
For each graph you see the do-file that made it, including the data for the graph or a use<br />
command. I suggest letting do-files generating graphs always start with a gph. prefix, for<br />
easy identification.<br />
In the illustrations I reduced the graph size by the xsize() and ysize() options. This,<br />
however, leads <strong>to</strong> <strong>to</strong>o small text and symbols, and I enlarged them by the scale() option.<br />
twoway graphs have continuous x- and y-axes. Many plot-types fit in twoway graphs;<br />
exceptions are graph bar, graph box and graph pie.<br />
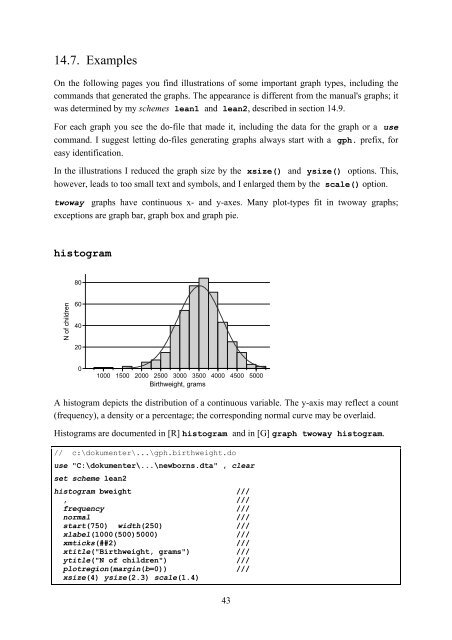
his<strong>to</strong>gram<br />
80<br />
N of children<br />
60<br />
40<br />
20<br />
0<br />
1000 1500 2000 2500 3000 3500 4000 4500 5000<br />
Birthweight, grams<br />
A his<strong>to</strong>gram depicts the distribution of a continuous variable. The y-axis may reflect a count<br />
(frequency), a density or a percentage; the corresponding normal curve may be overlaid.<br />
His<strong>to</strong>grams are documented in [R] his<strong>to</strong>gram and in [G] graph twoway his<strong>to</strong>gram.<br />
// c:\dokumenter\...\gph.birthweight.do<br />
use "C:\dokumenter\...\newborns.dta" , clear<br />
set scheme lean2<br />
his<strong>to</strong>gram bweight ///<br />
, ///<br />
frequency ///<br />
normal ///<br />
start(750) width(250) ///<br />
xlabel(1000(500)5000) ///<br />
xmticks(##2) ///<br />
xtitle("Birthweight, grams") ///<br />
ytitle("N of children") ///<br />
plotregion(margin(b=0)) ///<br />
xsize(4) ysize(2.3) scale(1.4)<br />
43