Introduction to Stata 8 - (GRIPS
Introduction to Stata 8 - (GRIPS
Introduction to Stata 8 - (GRIPS

You also want an ePaper? Increase the reach of your titles
YUMPU automatically turns print PDFs into web optimized ePapers that Google loves.
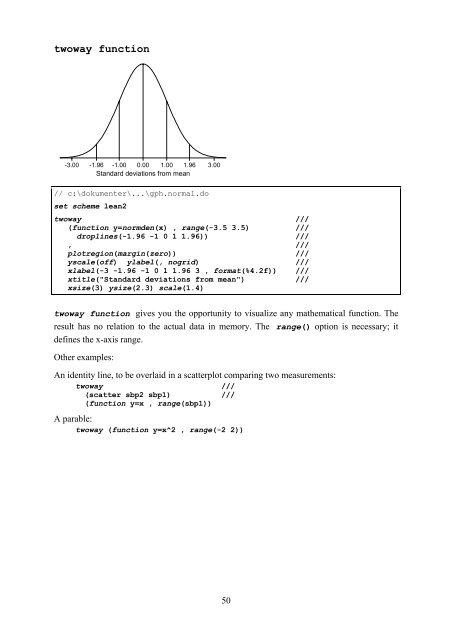
twoway function<br />
-3.00 -1.96 -1.00 0.00 1.00 1.96 3.00<br />
Standard deviations from mean<br />
// c:\dokumenter\...\gph.normal.do<br />
set scheme lean2<br />
twoway ///<br />
(function y=normden(x) , range(-3.5 3.5) ///<br />
droplines(-1.96 -1 0 1 1.96)) ///<br />
, ///<br />
plotregion(margin(zero)) ///<br />
yscale(off) ylabel(, nogrid) ///<br />
xlabel(-3 -1.96 -1 0 1 1.96 3 , format(%4.2f)) ///<br />
xtitle("Standard deviations from mean") ///<br />
xsize(3) ysize(2.3) scale(1.4)<br />
twoway function gives you the opportunity <strong>to</strong> visualize any mathematical function. The<br />
result has no relation <strong>to</strong> the actual data in memory. The range() option is necessary; it<br />
defines the x-axis range.<br />
Other examples:<br />
An identity line, <strong>to</strong> be overlaid in a scatterplot comparing two measurements:<br />
twoway ///<br />
(scatter sbp2 sbp1) ///<br />
(function y=x , range(sbp1))<br />
A parable:<br />
twoway (function y=x^2 , range(-2 2))<br />
50