Introduction to Stata 8 - (GRIPS
Introduction to Stata 8 - (GRIPS
Introduction to Stata 8 - (GRIPS

Create successful ePaper yourself
Turn your PDF publications into a flip-book with our unique Google optimized e-Paper software.
14.2. The ana<strong>to</strong>my of graphs<br />
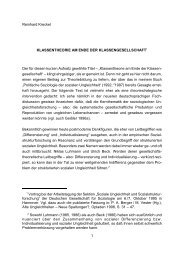
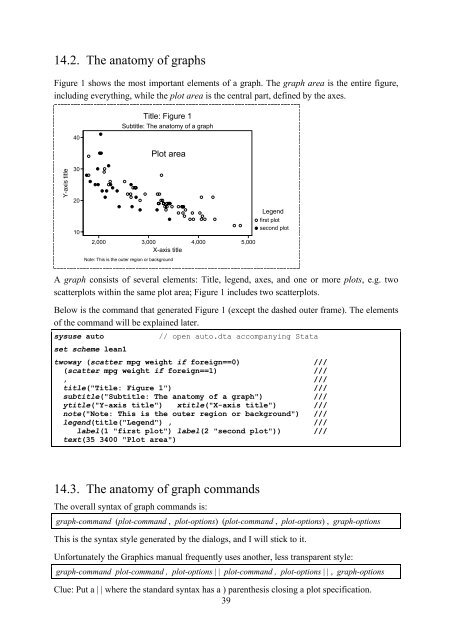
Figure 1 shows the most important elements of a graph. The graph area is the entire figure,<br />
including everything, while the plot area is the central part, defined by the axes.<br />
40<br />
Title: Figure 1<br />
Subtitle: The ana<strong>to</strong>my of a graph<br />
Plot area<br />
Y-axis title<br />
30<br />
20<br />
10<br />
2,000 3,000 4,000 5,000<br />
X-axis title<br />
Note: This is the outer region or background<br />
Legend<br />
first plot<br />
second plot<br />
A graph consists of several elements: Title, legend, axes, and one or more plots, e.g. two<br />
scatterplots within the same plot area; Figure 1 includes two scatterplots.<br />
Below is the command that generated Figure 1 (except the dashed outer frame). The elements<br />
of the command will be explained later.<br />
sysuse au<strong>to</strong><br />
set scheme lean1<br />
// open au<strong>to</strong>.dta accompanying <strong>Stata</strong><br />
twoway (scatter mpg weight if foreign==0) ///<br />
(scatter mpg weight if foreign==1) ///<br />
, ///<br />
title("Title: Figure 1") ///<br />
subtitle("Subtitle: The ana<strong>to</strong>my of a graph") ///<br />
ytitle("Y-axis title") xtitle("X-axis title") ///<br />
note("Note: This is the outer region or background") ///<br />
legend(title("Legend") , ///<br />
label(1 "first plot") label(2 "second plot")) ///<br />
text(35 3400 "Plot area")<br />
14.3. The ana<strong>to</strong>my of graph commands<br />
The overall syntax of graph commands is:<br />
graph-command (plot-command , plot-options) (plot-command , plot-options) , graph-options<br />
This is the syntax style generated by the dialogs, and I will stick <strong>to</strong> it.<br />
Unfortunately the Graphics manual frequently uses another, less transparent style:<br />
graph-command plot-command , plot-options | | plot-command , plot-options | | , graph-options<br />
Clue: Put a | | where the standard syntax has a ) parenthesis closing a plot specification.<br />
39