Introduction to Stata 8 - (GRIPS
Introduction to Stata 8 - (GRIPS
Introduction to Stata 8 - (GRIPS

Create successful ePaper yourself
Turn your PDF publications into a flip-book with our unique Google optimized e-Paper software.
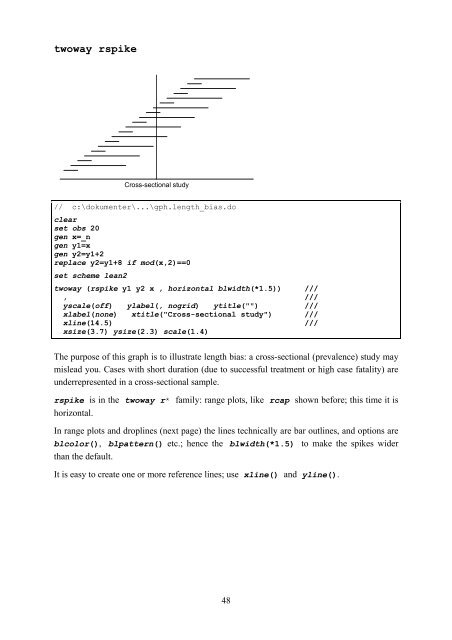
twoway rspike<br />
Cross-sectional study<br />
// c:\dokumenter\...\gph.length_bias.do<br />
clear<br />
set obs 20<br />
gen x=_n<br />
gen y1=x<br />
gen y2=y1+2<br />
replace y2=y1+8 if mod(x,2)==0<br />
set scheme lean2<br />
twoway (rspike y1 y2 x , horizontal blwidth(*1.5)) ///<br />
, ///<br />
yscale(off) ylabel(, nogrid) ytitle("") ///<br />
xlabel(none) xtitle("Cross-sectional study") ///<br />
xline(14.5) ///<br />
xsize(3.7) ysize(2.3) scale(1.4)<br />
The purpose of this graph is <strong>to</strong> illustrate length bias: a cross-sectional (prevalence) study may<br />
mislead you. Cases with short duration (due <strong>to</strong> successful treatment or high case fatality) are<br />
underrepresented in a cross-sectional sample.<br />
rspike is in the twoway r* family: range plots, like rcap shown before; this time it is<br />
horizontal.<br />
In range plots and droplines (next page) the lines technically are bar outlines, and options are<br />
blcolor(), blpattern() etc.; hence the blwidth(*1.5) <strong>to</strong> make the spikes wider<br />
than the default.<br />
It is easy <strong>to</strong> create one or more reference lines; use xline() and yline().<br />
48