CDE Appendix 1 Literature Review - Central East Local Health ...
CDE Appendix 1 Literature Review - Central East Local Health ...
CDE Appendix 1 Literature Review - Central East Local Health ...

You also want an ePaper? Increase the reach of your titles
YUMPU automatically turns print PDFs into web optimized ePapers that Google loves.
The Culture, Diversity and Equity Project: <strong>Literature</strong> <strong>Review</strong><br />
F. Reporting and Transparency<br />
Finally it is critical, to the establishment and maintenance of accountability, that the results of monitoring and<br />
assessment are regularly reported, ideally, to the public, and in a manner that allows for comparability of reported<br />
information across the health system.<br />
The production and publication of diversity/health equity report cards on an annual basis, available to the public, is a<br />
particularly good incentive for motivating action, compliance and good performance on health equity issues (GTA<br />
Diversity and LHINs Working Group, 2008a).<br />
The use of reports cards or scorecards as a means of measuring the progress of health disparities policies is a<br />
growing phenomenon in numerous jurisdictions (see Box 4.11 below for example of San Francisco <strong>Health</strong> Report<br />
Card; also see Trivedi et al., 2005; Davies, Washington, and Bindman, 2002; Nerenz et al., 2002/2005; Exworthy et<br />
al., 2006).<br />
Report cards have been found to be a useful means of sustaining direction and momentum and increasing<br />
accountability. In the broader UK governmental system of checks, report cards take the simple form of a traffic light<br />
(red for failure to meet targets, yellow for intermediate outcome, and green for passing or surpassing targets). It is<br />
important, moreover, that consequences are attached to performance outcomes, whether positive or negative.<br />
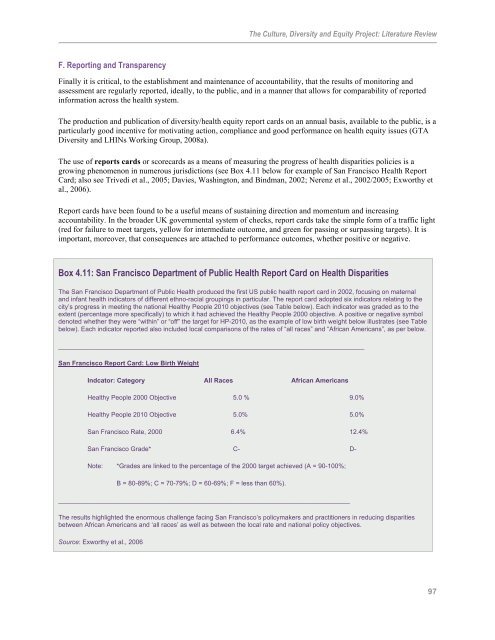
Box 4.11: San Francisco Department of Public <strong>Health</strong> Report Card on <strong>Health</strong> Disparities<br />
The San Francisco Department of Public <strong>Health</strong> produced the first US public health report card in 2002, focusing on maternal<br />
and infant health indicators of different ethno-racial groupings in particular. The report card adopted six indicators relating to the<br />
city’s progress in meeting the national <strong>Health</strong>y People 2010 objectives (see Table below). Each indicator was graded as to the<br />
extent (percentage more specifically) to which it had achieved the <strong>Health</strong>y People 2000 objective. A positive or negative symbol<br />
denoted whether they were “within” or “off” the target for HP-2010, as the example of low birth weight below illustrates (see Table<br />
below). Each indicator reported also included local comparisons of the rates of “all races” and “African Americans”, as per below.<br />
_____________________________________________________________________________________<br />
San Francisco Report Card: Low Birth Weight<br />
Indcator: Category All Races African Americans<br />
<strong>Health</strong>y People 2000 Objective 5.0 % 9.0%<br />
<strong>Health</strong>y People 2010 Objective 5.0% 5.0%<br />
San Francisco Rate, 2000 6.4% 12.4%<br />
San Francisco Grade* C- D-<br />
Note: *Grades are linked to the percentage of the 2000 target achieved (A = 90-100%;<br />
B = 80-89%; C = 70-79%; D = 60-69%; F = less than 60%).<br />
_________________________________________________________________________________<br />
The results highlighted the enormous challenge facing San Francisco’s policymakers and practitioners in reducing disparities<br />
between African Americans and ‘all races’ as well as between the local rate and national policy objectives.<br />
Source: Exworthy et al., 2006<br />
97