Complete Volume - Institute of Business Management
Complete Volume - Institute of Business Management
Complete Volume - Institute of Business Management

You also want an ePaper? Increase the reach of your titles
YUMPU automatically turns print PDFs into web optimized ePapers that Google loves.
Research<br />
Process Capability Analysis for Non Normal Data<br />
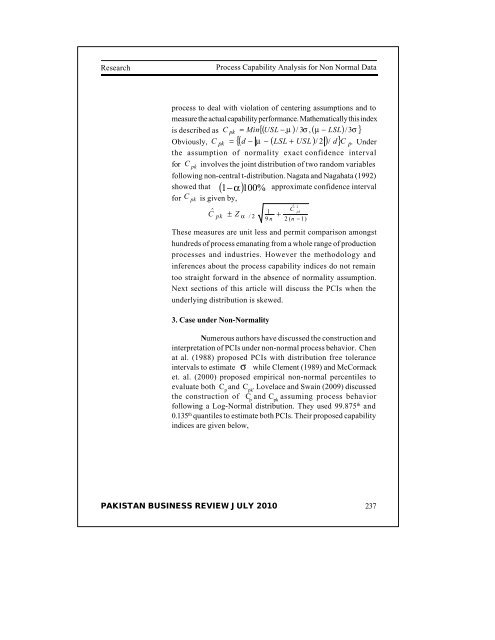
process to deal with violation <strong>of</strong> centering assumptions and to<br />
measure the actual capability performance. Mathematically this index<br />
is described as C pk = Min{ ( USL −.<br />
µ ) / 3σ<br />
, ( µ − LSL)<br />
/ 3σ<br />
}<br />
Obviously, C pk = {( d − µ − ( LSL + USL)<br />
/ 2 )/<br />
d} C p . Under<br />
the assumption <strong>of</strong> normality exact confidence interval<br />
for<br />
involves the joint distribution <strong>of</strong> two random variables<br />
following non-central t-distribution. Nagata and Nagahata (1992)<br />
showed that<br />
approximate confidence interval<br />
for<br />
C pk<br />
C pk<br />
( 1−α) 100%<br />
is given by,<br />
Cˆ<br />
pk<br />
± Z<br />
/ 2<br />
1<br />
9 n<br />
These measures are unit less and permit comparison amongst<br />
hundreds <strong>of</strong> process emanating from a whole range <strong>of</strong> production<br />
processes and industries. However the methodology and<br />
inferences about the process capability indices do not remain<br />
too straight forward in the absence <strong>of</strong> normality assumption.<br />
Next sections <strong>of</strong> this article will discuss the PCIs when the<br />
underlying distribution is skewed.<br />
3. Case under Non-Normality<br />
α<br />
2 ( n −1)<br />
Numerous authors have discussed the construction and<br />
interpretation <strong>of</strong> PCIs under non-normal process behavior. Chen<br />
at al. (1988) proposed PCIs with distribution free tolerance<br />
intervals to estimate σ while Clement (1989) and McCormack<br />
et. al. (2000) proposed empirical non-normal percentiles to<br />
evaluate both C p<br />
and C pk<br />
. Lovelace and Swain (2009) discussed<br />
the construction <strong>of</strong> C p<br />
and C pk<br />
assuming process behavior<br />
following a Log-Normal distribution. They used 99.875 th and<br />
0.135 th quantiles to estimate both PCIs. Their proposed capability<br />
indices are given below,<br />
+<br />
Cˆ<br />
2<br />
pk<br />
PAKISTAN BUSINESS REVIEW JULY 2010<br />
237