- Page 1 and 2:
Pakistan’s Balance of Payments Pr
- Page 3 and 4:
Pakistan’s Balance of Payments Pr
- Page 5 and 6:
Pakistan’s Balance of Payments Pr
- Page 7 and 8:
Pakistan’s Balance of Payments Pr
- Page 9 and 10:
Pakistan’s Balance of Payments Pr
- Page 11 and 12:
Pakistan’s Balance of Payments Pr
- Page 13 and 14:
Research Process Capability Analysi
- Page 15 and 16:
Research Process Capability Analysi
- Page 17 and 18:
Research Process Capability Analysi
- Page 19 and 20:
Research Process Capability Analysi
- Page 21 and 22:
Research Process Capability Analysi
- Page 23 and 24:
Cross Validation of Ryff Scales of
- Page 25 and 26:
Cross Validation of Ryff Scales of
- Page 27 and 28:
Cross Validation of Ryff Scales of
- Page 29 and 30:
Cross Validation of Ryff Scales of
- Page 31 and 32:
Cross Validation of Ryff Scales of
- Page 33 and 34:
Cross Validation of Ryff Scales of
- Page 35 and 36:
Cross Validation of Ryff Scales of
- Page 37 and 38:
Cross Validation of Ryff Scales of
- Page 39 and 40:
Differences in Mobile Service Perce
- Page 41 and 42:
Differences in Mobile Service Perce
- Page 43 and 44:
Differences in Mobile Service Perce
- Page 45 and 46:
Differences in Mobile Service Perce
- Page 47 and 48:
Differences in Mobile Service Perce
- Page 49 and 50:
Differences in Mobile Service Perce
- Page 51 and 52:
Differences in Mobile Service Perce
- Page 53 and 54:
Differences in Mobile Service Perce
- Page 55 and 56:
Differences in Mobile Service Perce
- Page 57 and 58:
Differences in Mobile Service Perce
- Page 59 and 60:
Differences in Mobile Service Perce
- Page 61 and 62:
Differences in Mobile Service Perce
- Page 63 and 64:
Differences in Mobile Service Perce
- Page 65 and 66:
Differences in Mobile Service Perce
- Page 67 and 68:
Differences in Mobile Service Perce
- Page 69 and 70:
Differences in Mobile Service Perce
- Page 71 and 72:
Differences in Mobile Service Perce
- Page 73 and 74:
Research The Relationship of Optimi
- Page 75 and 76:
Research The Relationship of Optimi
- Page 77 and 78:
Research The Relationship of Optimi
- Page 79 and 80:
Research The Relationship of Optimi
- Page 81 and 82:
Research The Relationship of Optimi
- Page 83 and 84:
Research The Relationship of Optimi
- Page 85 and 86:
Research The Relationship of Optimi
- Page 87 and 88:
Research The Relationship of Optimi
- Page 89 and 90:
Research The Relationship of Optimi
- Page 91 and 92:
Research The Incoherence of Islamic
- Page 93 and 94:
Research The Incoherence of Islamic
- Page 95 and 96:
Research The Incoherence of Islamic
- Page 97 and 98:
Research The Incoherence of Islamic
- Page 99 and 100:
Research The Incoherence of Islamic
- Page 101 and 102:
Research The Incoherence of Islamic
- Page 103 and 104:
Research The Incoherence of Islamic
- Page 105 and 106:
Research The Incoherence of Islamic
- Page 107 and 108:
Research The Impact of Positive Att
- Page 109 and 110:
Research The Impact of Positive Att
- Page 111 and 112: Research The Impact of Positive Att
- Page 113 and 114: Research The Impact of Positive Att
- Page 115 and 116: Research The Impact of Positive Att
- Page 117 and 118: Research The Impact of Positive Att
- Page 119 and 120: Research The Impact of Positive Att
- Page 121 and 122: Research The Impact of Positive Att
- Page 123 and 124: Research Optimism, Self-Confidence
- Page 125 and 126: Research Optimism, Self-Confidence
- Page 127 and 128: Research Optimism, Self-Confidence
- Page 129 and 130: Research Optimism, Self-Confidence
- Page 131 and 132: Research Optimism, Self-Confidence
- Page 133 and 134: Research Optimism, Self-Confidence
- Page 135 and 136: Research Optimism, Self-Confidence
- Page 137 and 138: Research Optimism, Self-Confidence
- Page 139 and 140: Research Optimism, Self-Confidence
- Page 141 and 142: Research Effect of Intrinsic and Ex
- Page 143 and 144: Research Effect of Intrinsic and Ex
- Page 145 and 146: Research Effect of Intrinsic and Ex
- Page 147 and 148: Research Effect of Intrinsic and Ex
- Page 149 and 150: Research Effect of Intrinsic and Ex
- Page 151 and 152: Research Index of Multiple Deprivat
- Page 153 and 154: Research Index of Multiple Deprivat
- Page 155 and 156: Research Index of Multiple Deprivat
- Page 157 and 158: Research Index of Multiple Deprivat
- Page 159 and 160: Research Index of Multiple Deprivat
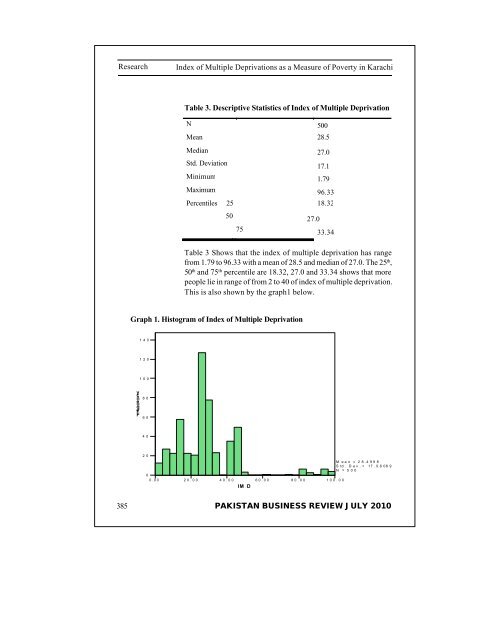
- Page 161: Research Index of Multiple Deprivat
- Page 165 and 166: Research Index of Multiple Deprivat
- Page 167 and 168: Research Index of Multiple Deprivat
- Page 169 and 170: Research Index of Multiple Deprivat
- Page 171 and 172: Discussion After The Crisis, Will C
- Page 173 and 174: Discussion After The Crisis, Will C
- Page 175 and 176: Discussion After The Crisis, Will C
- Page 177 and 178: Case Study Language Barrier in Rice
- Page 179 and 180: Case Study Language Barrier in Rice
- Page 181 and 182: Case Study Language Barrier in Rice
- Page 183 and 184: Case Study Language Barrier in Rice
- Page 185 and 186: Case Study Language Barrier in Rice
- Page 187 and 188: Case Study Language Barrier in Rice
- Page 189 and 190: Case Study Language Barrier in Rice
- Page 191 and 192: Case Study Language Barrier in Rice
- Page 193 and 194: Book Review Curriculum of Pakistan
- Page 195 and 196: Book Review Curriculum of Pakistan
- Page 197 and 198: Book Review Curriculum of English B
- Page 199 and 200: Book Review Linguistic Awareness in
- Page 201: Book Review Linguistic Awareness in


