You also want an ePaper? Increase the reach of your titles
YUMPU automatically turns print PDFs into web optimized ePapers that Google loves.
Mishipi Madema Nyavu RingNet Jarife Kaputi<br />
4.1.2. Observations on the 1 st TCZCDP Sampling Protocol<br />
There are many types of data that can be taken during sample surveys (mean catch, trip length,<br />
revenue per trip, the species composition, the fishing ground used, the weather, the time of fishing<br />
etc). These data can be used for a range of purposes. One of the most common uses of the catch<br />
and effort data is to calculate the catch per unit effort.<br />
Catch-Per-Unit-Effort (CPUE) - also called catch rate - is frequently the single most useful index for long-term<br />
monitoring of a fishery. Declines in CPUE may mean that the fish population cannot support the level of harvesting.<br />
Increases in CPUE may mean that a fish stock is recovering and more fishing effort can be applied.<br />
CPUE can therefore be used as an index of stock abundance, where some relationship is assumed between that<br />
index and the stock size. Catch rates by boat and gear categories, often combined with data on fish size at capture,<br />
permit a large number of analyses relating to gear selectivity, indices of exploitation and monitoring of economic<br />
efficiency. (Source: Anon, 2002).<br />
There are three issues on the use of CPUE related to the 1 st Sampling Protocol:<br />
• No fishing effort, except ‘fishing trip’, was recorded: Managers/researchers would be<br />
looking to observe what happens to the CPUE over time, that might reflect an increasing,<br />
stable or decreasing abundance of fish. However, without details on the actual fishing effort<br />
(ideally numbers of hours) other than numbers of trips it is possible that a change in CPUE<br />
(catch per trip) will not accurately reflect the abundance of fish because trip length may<br />
have changed and so fishers may be spending more (or less) time at sea to catch a given<br />
amount of fish.<br />
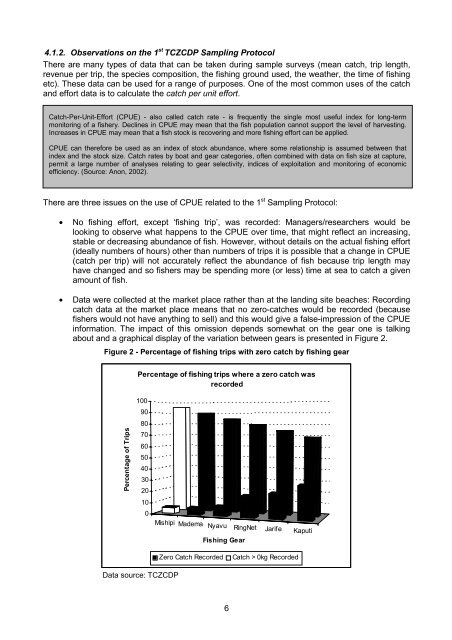
• Data were collected at the market place rather than at the landing site beaches: Recording<br />
catch data at the market place means that no zero-catches would be recorded (because<br />
fishers would not have anything to sell) and this would give a false-impression of the CPUE<br />
information. The impact of this omission depends somewhat on the gear one is talking<br />
about and a graphical display of the variation between gears is presented in Figure 2.<br />
Figure 2 - Percentage of fishing trips with zero catch by fishing gear<br />
Percentage of fishing trips where a zero catch was<br />
recorded<br />
100<br />
90<br />
80<br />
Percentage of Trips<br />
70<br />
60<br />
50<br />
40<br />
30<br />
20<br />
10<br />
0<br />
Fishing Gear<br />
Zero Catch Recorded<br />
Catch > 0kg Recorded<br />
Data source: TCZCDP<br />
6


