You also want an ePaper? Increase the reach of your titles
YUMPU automatically turns print PDFs into web optimized ePapers that Google loves.
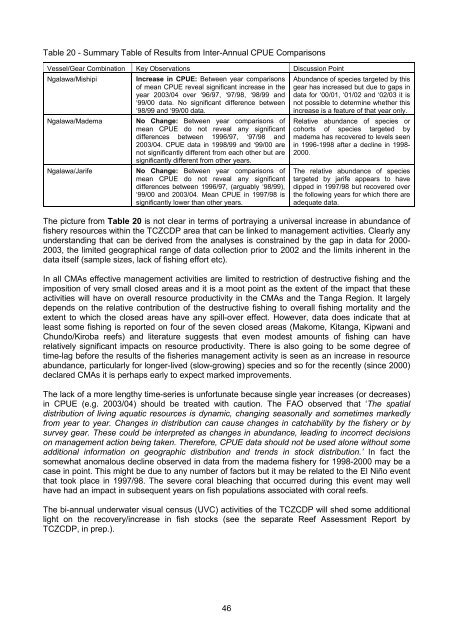
Table 20 - Summary Table of Results from Inter-Annual CPUE Comparisons<br />
Vessel/Gear Combination Key Observations Discussion Point<br />
Ngalawa/Mishipi<br />
Ngalawa/Madema<br />
Ngalawa/Jarife<br />
Increase in CPUE: Between year comparisons<br />
of mean CPUE reveal significant increase in the<br />
year 2003/04 over ‘96/97, ‘97/98, ‘98/99 and<br />
‘99/00 data. No significant difference between<br />
‘98/99 and ‘99/00 data.<br />
No Change: Between year comparisons of<br />
mean CPUE do not reveal any significant<br />
differences between 1996/97, ‘97/98 and<br />
2003/04. CPUE data in 1998/99 and ‘99/00 are<br />
not significantly different from each other but are<br />
significantly different from other years.<br />
No Change: Between year comparisons of<br />
mean CPUE do not reveal any significant<br />
differences between 1996/97, (arguably ‘98/99),<br />
‘99/00 and 2003/04. Mean CPUE in 1997/98 is<br />
significantly lower than other years.<br />
Abundance of species targeted by this<br />
gear has increased but due to gaps in<br />
data for ‘00/01, ‘01/02 and ‘02/03 it is<br />
not possible to determine whether this<br />
increase is a feature of that year only.<br />
Relative abundance of species or<br />
cohorts of species targeted by<br />
madema has recovered to levels seen<br />
in 1996-1998 after a decline in 1998-<br />
2000.<br />
The relative abundance of species<br />
targeted by jarife appears to have<br />
dipped in 1997/98 but recovered over<br />
the following years for which there are<br />
adequate data.<br />
The picture from Table 20 is not clear in terms of portraying a universal increase in abundance of<br />
fishery resources within the TCZCDP area that can be linked to management activities. Clearly any<br />
understanding that can be derived from the analyses is constrained by the gap in data for 2000-<br />
2003, the limited geographical range of data collection prior to 2002 and the limits inherent in the<br />
data itself (sample sizes, lack of fishing effort etc).<br />
In all CMAs effective management activities are limited to restriction of destructive fishing and the<br />
imposition of very small closed areas and it is a moot point as the extent of the impact that these<br />
activities will have on overall resource productivity in the CMAs and the <strong>Tanga</strong> Region. It largely<br />
depends on the relative contribution of the destructive fishing to overall fishing mortality and the<br />
extent to which the closed areas have any spill-over effect. However, data does indicate that at<br />
least some fishing is reported on four of the seven closed areas (Makome, Kitanga, Kipwani and<br />
Chundo/Kiroba reefs) and literature suggests that even modest amounts of fishing can have<br />
relatively significant impacts on resource productivity. There is also going to be some degree of<br />
time-lag before the results of the fisheries management activity is seen as an increase in resource<br />
abundance, particularly for longer-lived (slow-growing) species and so for the recently (since 2000)<br />
declared CMAs it is perhaps early to expect marked improvements.<br />
The lack of a more lengthy time-series is unfortunate because single year increases (or decreases)<br />
in CPUE (e.g. 2003/04) should be treated with caution. The FAO observed that ‘The spatial<br />
distribution of living aquatic resources is dynamic, changing seasonally and sometimes markedly<br />
from year to year. Changes in distribution can cause changes in catchability by the fishery or by<br />
survey gear. These could be interpreted as changes in abundance, leading to incorrect decisions<br />
on management action being taken. Therefore, CPUE data should not be used alone without some<br />
additional information on geographic distribution and trends in stock distribution.’ In fact the<br />
somewhat anomalous decline observed in data from the madema fishery for 1998-2000 may be a<br />
case in point. This might be due to any number of factors but it may be related to the El Niño event<br />
that took place in 1997/98. The severe coral bleaching that occurred during this event may well<br />
have had an impact in subsequent years on fish populations associated with coral reefs.<br />
The bi-annual underwater visual census (UVC) activities of the TCZCDP will shed some additional<br />
light on the recovery/increase in fish stocks (see the separate Reef Assessment Report by<br />
TCZCDP, in prep.).<br />
46


