Create successful ePaper yourself
Turn your PDF publications into a flip-book with our unique Google optimized e-Paper software.
Appendix 2 - Description of Pair-wise Comparisons<br />
ANOVA (with single factor) was used to evaluate the presence of significance differences between<br />
groups (years) with the null hypothesis that H 0 : µ 1 = µ 2 = µ 3 = µ 4 = µ 5 . Where ANOVA indicated a<br />
significant difference a multiple comparison Tukey Test was employed, with the Kramer<br />
modification for unequal sample size (Zar, 1999, p212), to determine between which groups’<br />
population means a difference existed.<br />
The data were tested for normality using both Excel Descriptive Statistics and Systat (V.10.2) using<br />
the Kolmogorov-Smirnov one-sample test reporting skewness and kurtosis. Skewness is ‘a<br />
measure of the symmetry of the distribution about its mean’ (Systat) and kurtosis indicates the<br />
length of the ‘tails’ in relation to what one expect in a normal distributed dataset. The data does<br />
appear to show some deviation from normality revealing a positiveness skewness (a long right-tail)<br />
and positive kurtosis (longer tails than expected). In this case a nonparametric analysis of variance<br />
(e.g. Kruskal-Wallis Test) might be considered appropriate but Zar (1999) indicates that a singlefactor<br />
analysis of variance (such as is proposed here, the single-factor being CPUE):<br />
‘…is also robust with respect to the assumption of the underlying populations’ normality. The<br />
validity of the analysis is affected only slightly by even considerable deviations from normality (in<br />
skewness and/or kurtosis), especially as n increases.’ (Zar, 1999, p185)<br />
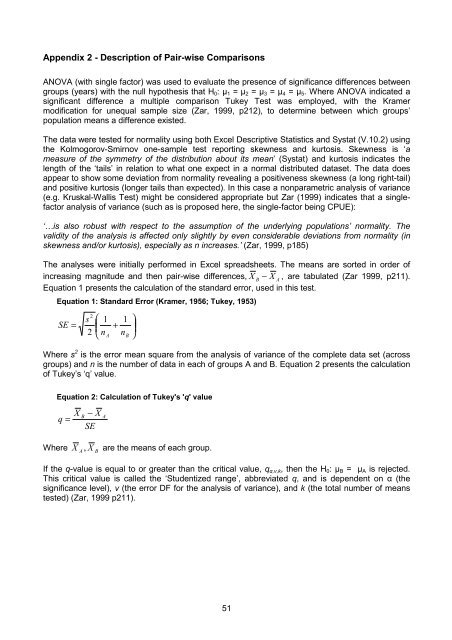
The analyses were initially performed in Excel spreadsheets. The means are sorted in order of<br />
increasing magnitude and then pair-wise differences, X<br />
B<br />
− X<br />
A<br />
, are tabulated (Zar 1999, p211).<br />
Equation 1 presents the calculation of the standard error, used in this test.<br />
Equation 1: Standard Error (Kramer, 1956; Tukey, 1953)<br />
SE =<br />
2<br />
s ⎛ 1 1 ⎞<br />
⎜ +<br />
⎟<br />
2 ⎝ n A<br />
n B ⎠<br />
Where s 2 is the error mean square from the analysis of variance of the complete data set (across<br />
groups) and n is the number of data in each of groups A and B. Equation 2 presents the calculation<br />
of Tukey’s ‘q’ value.<br />
Equation 2: Calculation of Tukey's 'q' value<br />
q =<br />
Where<br />
X<br />
A<br />
X<br />
SE<br />
B −<br />
B<br />
A<br />
X , X are the means of each group.<br />
If the q-value is equal to or greater than the critical value, q α,v,k , then the H 0 : µ B = µ A is rejected.<br />
This critical value is called the ‘Studentized range’, abbreviated q, and is dependent on α (the<br />
significance level), v (the error DF for the analysis of variance), and k (the total number of means<br />
tested) (Zar, 1999 p211).<br />
51


