
You also want an ePaper? Increase the reach of your titles
YUMPU automatically turns print PDFs into web optimized ePapers that Google loves.
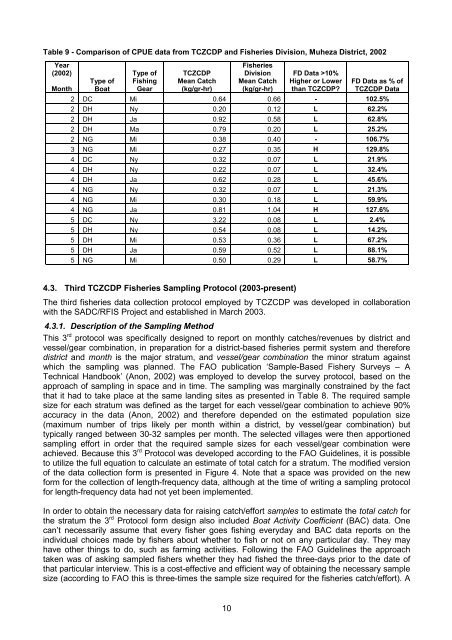
Table 9 - Comparison of CPUE data from TCZCDP and <strong>Fisheries</strong> Division, Muheza District, 2002<br />
Year<br />
(2002)<br />
Type of<br />
Fishing<br />
Gear<br />
TCZCDP<br />
Mean Catch<br />
(kg/gr-hr)<br />
<strong>Fisheries</strong><br />
Division<br />
Mean Catch<br />
(kg/gr-hr)<br />
FD Data >10%<br />
Higher or Lower<br />
than TCZCDP?<br />
Type of<br />
Month Boat<br />
2 DC Mi 0.64 0.66 - 102.5%<br />
FD Data as % of<br />
TCZCDP Data<br />
2 DH Ny 0.20 0.12 L 62.2%<br />
2 DH Ja 0.92 0.58 L 62.8%<br />
2 DH Ma 0.79 0.20 L 25.2%<br />
2 NG Mi 0.38 0.40 - 106.7%<br />
3 NG Mi 0.27 0.35 H 129.8%<br />
4 DC Ny 0.32 0.07 L 21.9%<br />
4 DH Ny 0.22 0.07 L 32.4%<br />
4 DH Ja 0.62 0.28 L 45.6%<br />
4 NG Ny 0.32 0.07 L 21.3%<br />
4 NG Mi 0.30 0.18 L 59.9%<br />
4 NG Ja 0.81 1.04 H 127.6%<br />
5 DC Ny 3.22 0.08 L 2.4%<br />
5 DH Ny 0.54 0.08 L 14.2%<br />
5 DH Mi 0.53 0.36 L 67.2%<br />
5 DH Ja 0.59 0.52 L 88.1%<br />
5 NG Mi 0.50 0.29 L 58.7%<br />
4.3. Third TCZCDP <strong>Fisheries</strong> Sampling Protocol (2003-present)<br />
The third fisheries data collection protocol employed by TCZCDP was developed in collaboration<br />
with the SADC/RFIS Project and established in March 2003.<br />
4.3.1. Description of the Sampling Method<br />
This 3 rd protocol was specifically designed to report on monthly catches/revenues by district and<br />
vessel/gear combination, in preparation for a district-based fisheries permit system and therefore<br />
district and month is the major stratum, and vessel/gear combination the minor stratum against<br />
which the sampling was planned. The FAO publication ‘Sample-Based Fishery Surveys – A<br />
Technical Handbook’ (Anon, 2002) was employed to develop the survey protocol, based on the<br />
approach of sampling in space and in time. The sampling was marginally constrained by the fact<br />
that it had to take place at the same landing sites as presented in Table 8. The required sample<br />
size for each stratum was defined as the target for each vessel/gear combination to achieve 90%<br />
accuracy in the data (Anon, 2002) and therefore depended on the estimated population size<br />
(maximum number of trips likely per month within a district, by vessel/gear combination) but<br />
typically ranged between 30-32 samples per month. The selected villages were then apportioned<br />
sampling effort in order that the required sample sizes for each vessel/gear combination were<br />
achieved. Because this 3 rd Protocol was developed according to the FAO Guidelines, it is possible<br />
to utilize the full equation to calculate an estimate of total catch for a stratum. The modified version<br />
of the data collection form is presented in Figure 4. Note that a space was provided on the new<br />
form for the collection of length-frequency data, although at the time of writing a sampling protocol<br />
for length-frequency data had not yet been implemented.<br />
In order to obtain the necessary data for raising catch/effort samples to estimate the total catch for<br />
the stratum the 3 rd Protocol form design also included Boat Activity Coefficient (BAC) data. One<br />
can’t necessarily assume that every fisher goes fishing everyday and BAC data reports on the<br />
individual choices made by fishers about whether to fish or not on any particular day. They may<br />
have other things to do, such as farming activities. Following the FAO Guidelines the approach<br />
taken was of asking sampled fishers whether they had fished the three-days prior to the date of<br />
that particular interview. This is a cost-effective and efficient way of obtaining the necessary sample<br />
size (according to FAO this is three-times the sample size required for the fisheries catch/effort). A<br />
10