
You also want an ePaper? Increase the reach of your titles
YUMPU automatically turns print PDFs into web optimized ePapers that Google loves.
7.2. The Spatial and Temporal profile of Fishing Effort and Catch-rate<br />
7.2.1. Annual Variations in CPUE for Ngalawa using Mishipi<br />
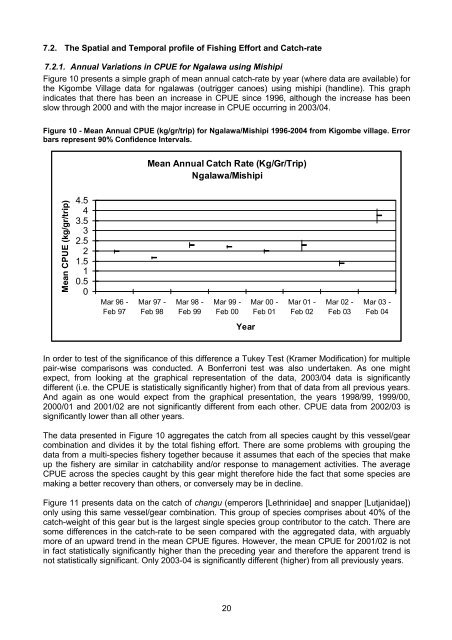
Figure 10 presents a simple graph of mean annual catch-rate by year (where data are available) for<br />
the Kigombe Village data for ngalawas (outrigger canoes) using mishipi (handline). This graph<br />
indicates that there has been an increase in CPUE since 1996, although the increase has been<br />
slow through 2000 and with the major increase in CPUE occurring in 2003/04.<br />
Figure 10 - Mean Annual CPUE (kg/gr/trip) for Ngalawa/Mishipi 1996-2004 from Kigombe village. Error<br />
bars represent 90% Confidence Intervals.<br />
Mean Annual Catch Rate (Kg/Gr/Trip)<br />
Ngalawa/Mishipi<br />
Mean CPUE (kg/gr/trip)<br />
4.5<br />
4<br />
3.5<br />
3<br />
2.5<br />
2<br />
1.5<br />
1<br />
0.5<br />
0<br />
Mar 96 -<br />
Feb 97<br />
Mar 97 -<br />
Feb 98<br />
Mar 98 -<br />
Feb 99<br />
Mar 99 -<br />
Feb 00<br />
Mar 00 -<br />
Feb 01<br />
Mar 01 -<br />
Feb 02<br />
Mar 02 -<br />
Feb 03<br />
Mar 03 -<br />
Feb 04<br />
Year<br />
In order to test of the significance of this difference a Tukey Test (Kramer Modification) for multiple<br />
pair-wise comparisons was conducted. A Bonferroni test was also undertaken. As one might<br />
expect, from looking at the graphical representation of the data, 2003/04 data is significantly<br />
different (i.e. the CPUE is statistically significantly higher) from that of data from all previous years.<br />
And again as one would expect from the graphical presentation, the years 1998/99, 1999/00,<br />
2000/01 and 2001/02 are not significantly different from each other. CPUE data from 2002/03 is<br />
significantly lower than all other years.<br />
The data presented in Figure 10 aggregates the catch from all species caught by this vessel/gear<br />
combination and divides it by the total fishing effort. There are some problems with grouping the<br />
data from a multi-species fishery together because it assumes that each of the species that make<br />
up the fishery are similar in catchability and/or response to management activities. The average<br />
CPUE across the species caught by this gear might therefore hide the fact that some species are<br />
making a better recovery than others, or conversely may be in decline.<br />
Figure 11 presents data on the catch of changu (emperors [Lethrinidae] and snapper [Lutjanidae])<br />
only using this same vessel/gear combination. This group of species comprises about 40% of the<br />
catch-weight of this gear but is the largest single species group contributor to the catch. There are<br />
some differences in the catch-rate to be seen compared with the aggregated data, with arguably<br />
more of an upward trend in the mean CPUE figures. However, the mean CPUE for 2001/02 is not<br />
in fact statistically significantly higher than the preceding year and therefore the apparent trend is<br />
not statistically significant. Only 2003-04 is significantly different (higher) from all previously years.<br />
20