
You also want an ePaper? Increase the reach of your titles
YUMPU automatically turns print PDFs into web optimized ePapers that Google loves.
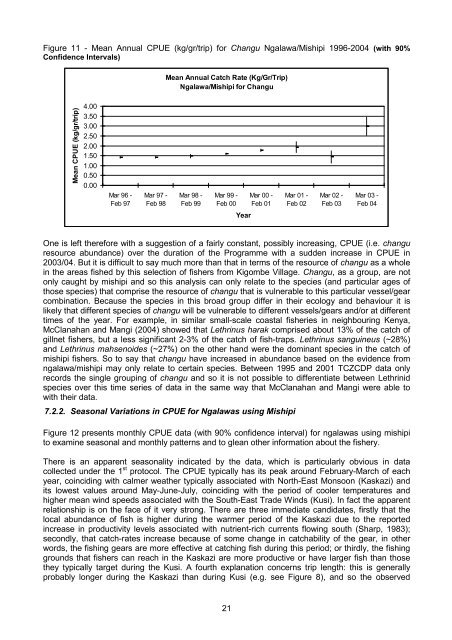
Figure 11 - Mean Annual CPUE (kg/gr/trip) for Changu Ngalawa/Mishipi 1996-2004 (with 90%<br />
Confidence Intervals)<br />
Mean Annual Catch Rate (Kg/Gr/Trip)<br />
Ngalawa/Mishipi for Changu<br />
Mean CPUE (kg/gr/trip)<br />
4.00<br />
3.50<br />
3.00<br />
2.50<br />
2.00<br />
1.50<br />
1.00<br />
0.50<br />
0.00<br />
Mar 96 -<br />
Feb 97<br />
Mar 97 -<br />
Feb 98<br />
Mar 98 -<br />
Feb 99<br />
Mar 99 -<br />
Feb 00<br />
Mar 00 -<br />
Feb 01<br />
Mar 01 -<br />
Feb 02<br />
Mar 02 -<br />
Feb 03<br />
Mar 03 -<br />
Feb 04<br />
Year<br />
One is left therefore with a suggestion of a fairly constant, possibly increasing, CPUE (i.e. changu<br />
resource abundance) over the duration of the Programme with a sudden increase in CPUE in<br />
2003/04. But it is difficult to say much more than that in terms of the resource of changu as a whole<br />
in the areas fished by this selection of fishers from Kigombe Village. Changu, as a group, are not<br />
only caught by mishipi and so this analysis can only relate to the species (and particular ages of<br />
those species) that comprise the resource of changu that is vulnerable to this particular vessel/gear<br />
combination. Because the species in this broad group differ in their ecology and behaviour it is<br />
likely that different species of changu will be vulnerable to different vessels/gears and/or at different<br />
times of the year. For example, in similar small-scale coastal fisheries in neighbouring Kenya,<br />
McClanahan and Mangi (2004) showed that Lethrinus harak comprised about 13% of the catch of<br />
gillnet fishers, but a less significant 2-3% of the catch of fish-traps. Lethrinus sanguineus (~28%)<br />
and Lethrinus mahsenoides (~27%) on the other hand were the dominant species in the catch of<br />
mishipi fishers. So to say that changu have increased in abundance based on the evidence from<br />
ngalawa/mishipi may only relate to certain species. Between 1995 and 2001 TCZCDP data only<br />
records the single grouping of changu and so it is not possible to differentiate between Lethrinid<br />
species over this time series of data in the same way that McClanahan and Mangi were able to<br />
with their data.<br />
7.2.2. Seasonal Variations in CPUE for Ngalawas using Mishipi<br />
Figure 12 presents monthly CPUE data (with 90% confidence interval) for ngalawas using mishipi<br />
to examine seasonal and monthly patterns and to glean other information about the fishery.<br />
There is an apparent seasonality indicated by the data, which is particularly obvious in data<br />
collected under the 1 st protocol. The CPUE typically has its peak around February-March of each<br />
year, coinciding with calmer weather typically associated with North-East Monsoon (Kaskazi) and<br />
its lowest values around May-June-July, coinciding with the period of cooler temperatures and<br />
higher mean wind speeds associated with the South-East Trade Winds (Kusi). In fact the apparent<br />
relationship is on the face of it very strong. There are three immediate candidates, firstly that the<br />
local abundance of fish is higher during the warmer period of the Kaskazi due to the reported<br />
increase in productivity levels associated with nutrient-rich currents flowing south (Sharp, 1983);<br />
secondly, that catch-rates increase because of some change in catchability of the gear, in other<br />
words, the fishing gears are more effective at catching fish during this period; or thirdly, the fishing<br />
grounds that fishers can reach in the Kaskazi are more productive or have larger fish than those<br />
they typically target during the Kusi. A fourth explanation concerns trip length: this is generally<br />
probably longer during the Kaskazi than during Kusi (e.g. see Figure 8), and so the observed<br />
21