
Create successful ePaper yourself
Turn your PDF publications into a flip-book with our unique Google optimized e-Paper software.
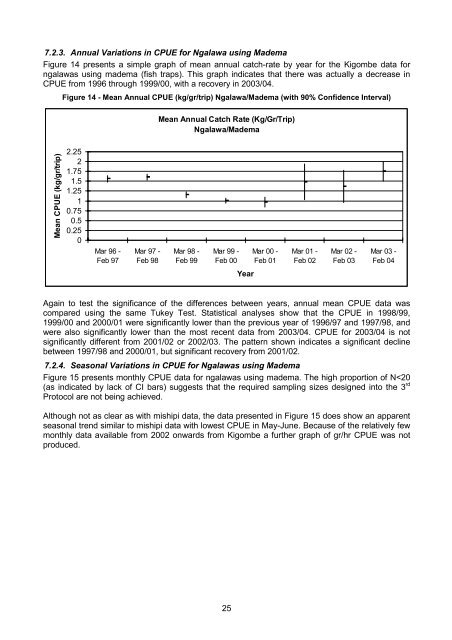
7.2.3. Annual Variations in CPUE for Ngalawa using Madema<br />
Figure 14 presents a simple graph of mean annual catch-rate by year for the Kigombe data for<br />
ngalawas using madema (fish traps). This graph indicates that there was actually a decrease in<br />
CPUE from 1996 through 1999/00, with a recovery in 2003/04.<br />
Figure 14 - Mean Annual CPUE (kg/gr/trip) Ngalawa/Madema (with 90% Confidence Interval)<br />
Mean Annual Catch Rate (Kg/Gr/Trip)<br />
Ngalawa/Madema<br />
Mean CPUE (kg/gr/trip)<br />
2.25<br />
2<br />
1.75<br />
1.5<br />
1.25<br />
1<br />
0.75<br />
0.5<br />
0.25<br />
0<br />
Mar 96 -<br />
Feb 97<br />
Mar 97 -<br />
Feb 98<br />
Mar 98 -<br />
Feb 99<br />
Mar 99 -<br />
Feb 00<br />
Mar 00 -<br />
Feb 01<br />
Mar 01 -<br />
Feb 02<br />
Mar 02 -<br />
Feb 03<br />
Mar 03 -<br />
Feb 04<br />
Year<br />
Again to test the significance of the differences between years, annual mean CPUE data was<br />
compared using the same Tukey Test. Statistical analyses show that the CPUE in 1998/99,<br />
1999/00 and 2000/01 were significantly lower than the previous year of 1996/97 and 1997/98, and<br />
were also significantly lower than the most recent data from 2003/04. CPUE for 2003/04 is not<br />
significantly different from 2001/02 or 2002/03. The pattern shown indicates a significant decline<br />
between 1997/98 and 2000/01, but significant recovery from 2001/02.<br />
7.2.4. Seasonal Variations in CPUE for Ngalawas using Madema<br />
Figure 15 presents monthly CPUE data for ngalawas using madema. The high proportion of N