
Create successful ePaper yourself
Turn your PDF publications into a flip-book with our unique Google optimized e-Paper software.
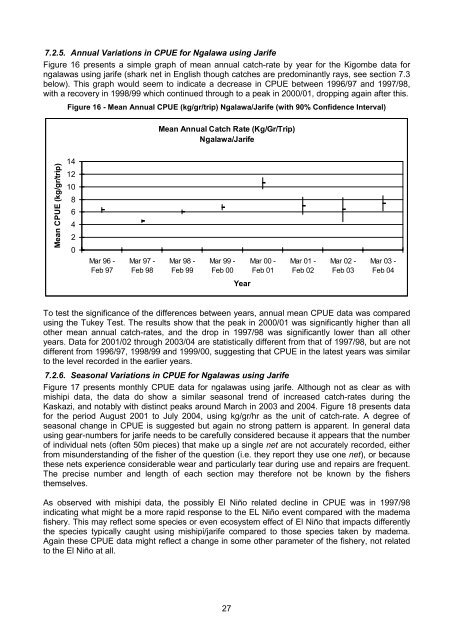
7.2.5. Annual Variations in CPUE for Ngalawa using Jarife<br />
Figure 16 presents a simple graph of mean annual catch-rate by year for the Kigombe data for<br />
ngalawas using jarife (shark net in English though catches are predominantly rays, see section 7.3<br />
below). This graph would seem to indicate a decrease in CPUE between 1996/97 and 1997/98,<br />
with a recovery in 1998/99 which continued through to a peak in 2000/01, dropping again after this.<br />
Figure 16 - Mean Annual CPUE (kg/gr/trip) Ngalawa/Jarife (with 90% Confidence Interval)<br />
Mean Annual Catch Rate (Kg/Gr/Trip)<br />
Ngalawa/Jarife<br />
Mean CPUE (kg/gr/trip)<br />
14<br />
12<br />
10<br />
8<br />
6<br />
4<br />
2<br />
0<br />
Mar 96 -<br />
Feb 97<br />
Mar 97 -<br />
Feb 98<br />
Mar 98 -<br />
Feb 99<br />
Mar 99 -<br />
Feb 00<br />
Mar 00 -<br />
Feb 01<br />
Mar 01 -<br />
Feb 02<br />
Mar 02 -<br />
Feb 03<br />
Mar 03 -<br />
Feb 04<br />
Year<br />
To test the significance of the differences between years, annual mean CPUE data was compared<br />
using the Tukey Test. The results show that the peak in 2000/01 was significantly higher than all<br />
other mean annual catch-rates, and the drop in 1997/98 was significantly lower than all other<br />
years. Data for 2001/02 through 2003/04 are statistically different from that of 1997/98, but are not<br />
different from 1996/97, 1998/99 and 1999/00, suggesting that CPUE in the latest years was similar<br />
to the level recorded in the earlier years.<br />
7.2.6. Seasonal Variations in CPUE for Ngalawas using Jarife<br />
Figure 17 presents monthly CPUE data for ngalawas using jarife. Although not as clear as with<br />
mishipi data, the data do show a similar seasonal trend of increased catch-rates during the<br />
Kaskazi, and notably with distinct peaks around March in 2003 and 2004. Figure 18 presents data<br />
for the period August 2001 to July 2004, using kg/gr/hr as the unit of catch-rate. A degree of<br />
seasonal change in CPUE is suggested but again no strong pattern is apparent. In general data<br />
using gear-numbers for jarife needs to be carefully considered because it appears that the number<br />
of individual nets (often 50m pieces) that make up a single net are not accurately recorded, either<br />
from misunderstanding of the fisher of the question (i.e. they report they use one net), or because<br />
these nets experience considerable wear and particularly tear during use and repairs are frequent.<br />
The precise number and length of each section may therefore not be known by the fishers<br />
themselves.<br />
As observed with mishipi data, the possibly El Niño related decline in CPUE was in 1997/98<br />
indicating what might be a more rapid response to the EL Niño event compared with the madema<br />
fishery. This may reflect some species or even ecosystem effect of El Niño that impacts differently<br />
the species typically caught using mishipi/jarife compared to those species taken by madema.<br />
Again these CPUE data might reflect a change in some other parameter of the fishery, not related<br />
to the El Niño at all.<br />
27