
Create successful ePaper yourself
Turn your PDF publications into a flip-book with our unique Google optimized e-Paper software.
• Data for spatial analysis over the period 1995-2004 was restricted to the principle ground (i.e.<br />
from where the majority of the fishing effort was recorded pre-2001) of Majivike. Analyses<br />
related to wider geographical coverage of course sought to utilise all available (post-2001) data;<br />
• No zero-catch fishing trips were recorded under the 1 st protocol, as noted in 4.1, and therefore<br />
in a further attempt to standardize the data across the years, zero-catches were excluded from<br />
the CPUE data derived from the 2 nd and 3 rd protocols;<br />
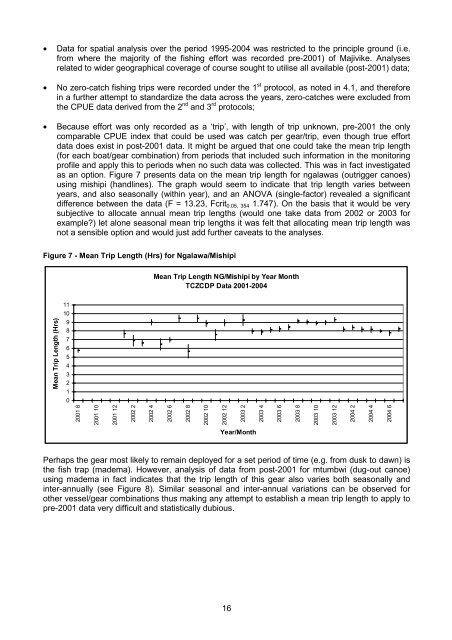
• Because effort was only recorded as a ‘trip’, with length of trip unknown, pre-2001 the only<br />
comparable CPUE index that could be used was catch per gear/trip, even though true effort<br />
data does exist in post-2001 data. It might be argued that one could take the mean trip length<br />
(for each boat/gear combination) from periods that included such information in the monitoring<br />
profile and apply this to periods when no such data was collected. This was in fact investigated<br />
as an option. Figure 7 presents data on the mean trip length for ngalawas (outrigger canoes)<br />
using mishipi (handlines). The graph would seem to indicate that trip length varies between<br />
years, and also seasonally (within year), and an ANOVA (single-factor) revealed a significant<br />
difference between the data (F = 13.23, Fcrit 0.05, 354 1.747). On the basis that it would be very<br />
subjective to allocate annual mean trip lengths (would one take data from 2002 or 2003 for<br />
example?) let alone seasonal mean trip lengths it was felt that allocating mean trip length was<br />
not a sensible option and would just add further caveats to the analyses.<br />
Figure 7 - Mean Trip Length (Hrs) for Ngalawa/Mishipi<br />
Mean Trip Length NG/Mishipi by Year Month<br />
TCZCDP Data 2001-2004<br />
11<br />
10<br />
9<br />
8<br />
7<br />
6<br />
5<br />
4<br />
3<br />
2<br />
1<br />
0<br />
2001 8<br />
2001 10<br />
2001 12<br />
2002 2<br />
2002 4<br />
2002 6<br />
2002 8<br />
2002 10<br />
2002 12<br />
2003 2<br />
2003 4<br />
2003 6<br />
2003 8<br />
2003 10<br />
2003 12<br />
2004 2<br />
Mean Trip Length (Hrs)<br />
2004 4<br />
2004 6<br />
Year/Month<br />
Perhaps the gear most likely to remain deployed for a set period of time (e.g. from dusk to dawn) is<br />
the fish trap (madema). However, analysis of data from post-2001 for mtumbwi (dug-out canoe)<br />
using madema in fact indicates that the trip length of this gear also varies both seasonally and<br />
inter-annually (see Figure 8). Similar seasonal and inter-annual variations can be observed for<br />
other vessel/gear combinations thus making any attempt to establish a mean trip length to apply to<br />
pre-2001 data very difficult and statistically dubious.<br />
16