
Create successful ePaper yourself
Turn your PDF publications into a flip-book with our unique Google optimized e-Paper software.
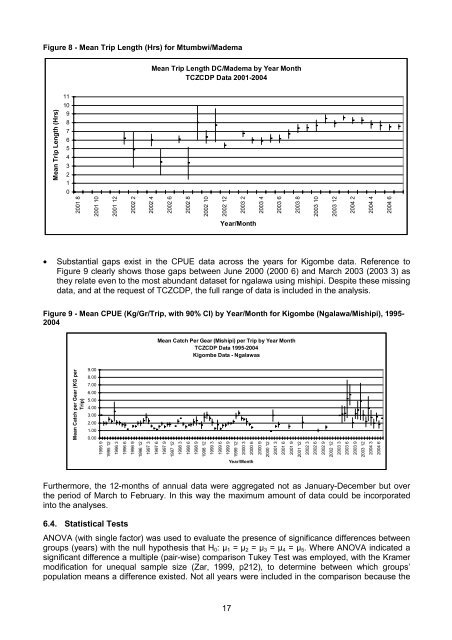
Figure 8 - Mean Trip Length (Hrs) for Mtumbwi/Madema<br />
Mean Trip Length DC/Madema by Year Month<br />
TCZCDP Data 2001-2004<br />
11<br />
10<br />
9<br />
8<br />
7<br />
6<br />
5<br />
4<br />
3<br />
2<br />
1<br />
0<br />
2001 8<br />
2001 10<br />
2001 12<br />
2002 2<br />
2002 4<br />
2002 6<br />
2002 8<br />
2002 10<br />
2002 12<br />
2003 2<br />
2003 4<br />
2003 6<br />
2003 8<br />
2003 10<br />
2003 12<br />
2004 2<br />
2004 4<br />
2004 6<br />
Mean Trip Length (Hrs)<br />
Year/Month<br />
• Substantial gaps exist in the CPUE data across the years for Kigombe data. Reference to<br />
Figure 9 clearly shows those gaps between June 2000 (2000 6) and March 2003 (2003 3) as<br />
they relate even to the most abundant dataset for ngalawa using mishipi. Despite these missing<br />
data, and at the request of TCZCDP, the full range of data is included in the analysis.<br />
Figure 9 - Mean CPUE (Kg/Gr/Trip, with 90% CI) by Year/Month for Kigombe (Ngalawa/Mishipi), 1995-<br />
2004<br />
Mean Catch Per Gear (Mishipi) per Trip by Year Month<br />
TCZCDP Data 1995-2004<br />
Kigombe Data - Ngalawas<br />
Mean Catch per Gear (KG per<br />
Trip)<br />
9.00<br />
8.00<br />
7.00<br />
6.00<br />
5.00<br />
4.00<br />
3.00<br />
2.00<br />
1.00<br />
0.00<br />
1995 9<br />
1995 12<br />
1996 3<br />
1996 6<br />
1996 9<br />
1996 12<br />
1997 3<br />
1997 6<br />
1997 9<br />
1997 12<br />
1998 3<br />
1998 6<br />
1998 9<br />
1998 12<br />
1999 3<br />
1999 6<br />
1999 9<br />
1999 12<br />
2000 3<br />
2000 6<br />
2000 9<br />
2000 12<br />
2001 3<br />
2001 6<br />
2001 9<br />
2001 12<br />
2002 3<br />
2002 6<br />
2002 9<br />
2002 12<br />
2003 3<br />
2003 6<br />
2003 9<br />
2003 12<br />
2004 3<br />
2004 6<br />
Year/Month<br />
Furthermore, the 12-months of annual data were aggregated not as January-December but over<br />
the period of March to February. In this way the maximum amount of data could be incorporated<br />
into the analyses.<br />
6.4. Statistical Tests<br />
ANOVA (with single factor) was used to evaluate the presence of significance differences between<br />
groups (years) with the null hypothesis that H 0 : µ 1 = µ 2 = µ 3 = µ 4 = µ 5 . Where ANOVA indicated a<br />
significant difference a multiple (pair-wise) comparison Tukey Test was employed, with the Kramer<br />
modification for unequal sample size (Zar, 1999, p212), to determine between which groups’<br />
population means a difference existed. Not all years were included in the comparison because the<br />
17