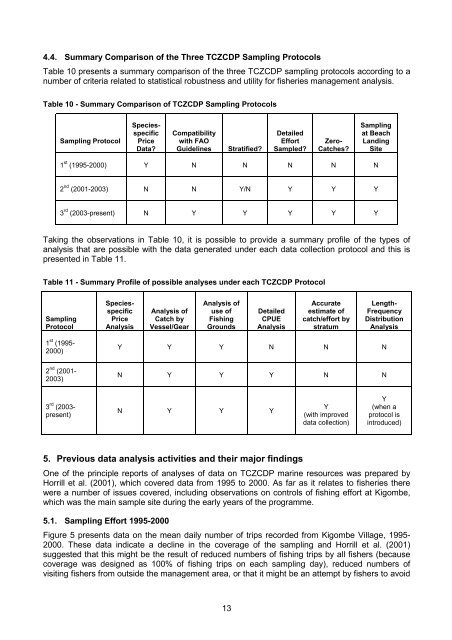

You also want an ePaper? Increase the reach of your titles
YUMPU automatically turns print PDFs into web optimized ePapers that Google loves.
4.4. Summary Comparison of the Three TCZCDP Sampling Protocols<br />
Table 10 presents a summary comparison of the three TCZCDP sampling protocols according to a<br />
number of criteria related to statistical robustness and utility for fisheries management analysis.<br />
Table 10 - Summary Comparison of TCZCDP Sampling Protocols<br />
Sampling Protocol<br />
Speciesspecific<br />
Price<br />
Data?<br />
Compatibility<br />
with FAO<br />
Guidelines<br />
Stratified?<br />
Detailed<br />
Effort<br />
Sampled?<br />
Zero-<br />
Catches?<br />
Sampling<br />
at Beach<br />
Landing<br />
Site<br />
1 st (1995-2000) Y N N N N N<br />
2 nd (2001-2003) N N Y/N Y Y Y<br />
3 rd (2003-present) N Y Y Y Y Y<br />
Taking the observations in Table 10, it is possible to provide a summary profile of the types of<br />
analysis that are possible with the data generated under each data collection protocol and this is<br />
presented in Table 11.<br />
Table 11 - Summary Profile of possible analyses under each TCZCDP Protocol<br />
Sampling<br />
Protocol<br />
Speciesspecific<br />
Price<br />
<strong>Analysis</strong><br />
<strong>Analysis</strong> of<br />
Catch by<br />
Vessel/Gear<br />
<strong>Analysis</strong> of<br />
use of<br />
Fishing<br />
Grounds<br />
Detailed<br />
CPUE<br />
<strong>Analysis</strong><br />
Accurate<br />
estimate of<br />
catch/effort by<br />
stratum<br />
Length-<br />
Frequency<br />
Distribution<br />
<strong>Analysis</strong><br />
1 st (1995-<br />
2000)<br />
Y Y Y N N N<br />
2 nd (2001-<br />
2003)<br />
N Y Y Y N N<br />
3 rd (2003-<br />
present)<br />
N Y Y Y<br />
Y<br />
(with improved<br />
data collection)<br />
Y<br />
(when a<br />
protocol is<br />
introduced)<br />
5. Previous data analysis activities and their major findings<br />
One of the principle reports of analyses of data on TCZCDP marine resources was prepared by<br />
Horrill et al. (2001), which covered data from 1995 to 2000. As far as it relates to fisheries there<br />
were a number of issues covered, including observations on controls of fishing effort at Kigombe,<br />
which was the main sample site during the early years of the programme.<br />
5.1. Sampling Effort 1995-2000<br />
Figure 5 presents data on the mean daily number of trips recorded from Kigombe Village, 1995-<br />
2000. These data indicate a decline in the coverage of the sampling and Horrill et al. (2001)<br />
suggested that this might be the result of reduced numbers of fishing trips by all fishers (because<br />
coverage was designed as 100% of fishing trips on each sampling day), reduced numbers of<br />
visiting fishers from outside the management area, or that it might be an attempt by fishers to avoid<br />
13