You also want an ePaper? Increase the reach of your titles
YUMPU automatically turns print PDFs into web optimized ePapers that Google loves.
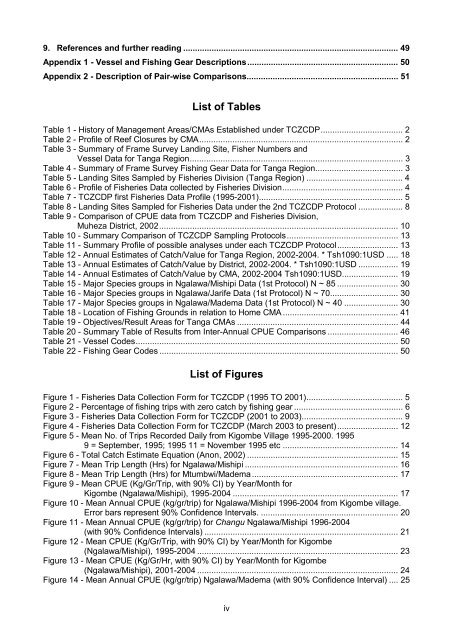
9. References and further reading ........................................................................................... 49<br />
Appendix 1 - Vessel and Fishing Gear Descriptions................................................................ 50<br />
Appendix 2 - Description of Pair-wise Comparisons................................................................ 51<br />
List of Tables<br />
Table 1 - History of Management Areas/CMAs Established under TCZCDP................................... 2<br />
Table 2 - Profile of Reef Closures by CMA...................................................................................... 2<br />
Table 3 - Summary of Frame Survey Landing Site, Fisher Numbers and<br />
Vessel Data for <strong>Tanga</strong> Region.......................................................................................... 3<br />
Table 4 - Summary of Frame Survey Fishing Gear Data for <strong>Tanga</strong> Region..................................... 3<br />
Table 5 - Landing Sites Sampled by <strong>Fisheries</strong> Division (<strong>Tanga</strong> Region) ......................................... 4<br />
Table 6 - Profile of <strong>Fisheries</strong> Data collected by <strong>Fisheries</strong> Division................................................... 4<br />
Table 7 - TCZCDP first <strong>Fisheries</strong> Data Profile (1995-2001)............................................................. 5<br />
Table 8 - Landing Sites Sampled for <strong>Fisheries</strong> Data under the 2nd TCZCDP Protocol ................... 8<br />
Table 9 - Comparison of CPUE data from TCZCDP and <strong>Fisheries</strong> Division,<br />
Muheza District, 2002..................................................................................................... 10<br />
Table 10 - Summary Comparison of TCZCDP Sampling Protocols............................................... 13<br />
Table 11 - Summary Profile of possible analyses under each TCZCDP Protocol.......................... 13<br />
Table 12 - Annual Estimates of Catch/Value for <strong>Tanga</strong> Region, 2002-2004. * Tsh1090:1USD ..... 18<br />
Table 13 - Annual Estimates of Catch/Value by District, 2002-2004. * Tsh1090:1USD ................. 19<br />
Table 14 - Annual Estimates of Catch/Value by CMA, 2002-2004 Tsh1090:1USD........................ 19<br />
Table 15 - Major Species groups in Ngalawa/Mishipi Data (1st Protocol) N ~ 85 .......................... 30<br />
Table 16 - Major Species groups in Ngalawa/Jarife Data (1st Protocol) N ~ 70............................. 30<br />
Table 17 - Major Species groups in Ngalawa/Madema Data (1st Protocol) N ~ 40 ....................... 30<br />
Table 18 - Location of Fishing Grounds in relation to Home CMA ................................................. 41<br />
Table 19 - Objectives/Result Areas for <strong>Tanga</strong> CMAs .................................................................... 44<br />
Table 20 - Summary Table of Results from Inter-Annual CPUE Comparisons .............................. 46<br />
Table 21 - Vessel Codes............................................................................................................... 50<br />
Table 22 - Fishing Gear Codes ..................................................................................................... 50<br />
List of Figures<br />
Figure 1 - <strong>Fisheries</strong> Data Collection Form for TCZCDP (1995 TO 2001)......................................... 5<br />
Figure 2 - Percentage of fishing trips with zero catch by fishing gear .............................................. 6<br />
Figure 3 - <strong>Fisheries</strong> Data Collection Form for TCZCDP (2001 to 2003)........................................... 9<br />
Figure 4 - <strong>Fisheries</strong> Data Collection Form for TCZCDP (March 2003 to present).......................... 12<br />
Figure 5 - Mean No. of Trips Recorded Daily from Kigombe Village 1995-2000. 1995<br />
9 = September, 1995; 1995 11 = November 1995 etc ................................................. 14<br />
Figure 6 - Total Catch Estimate Equation (Anon, 2002) ................................................................ 15<br />
Figure 7 - Mean Trip Length (Hrs) for Ngalawa/Mishipi ................................................................. 16<br />
Figure 8 - Mean Trip Length (Hrs) for Mtumbwi/Madema .............................................................. 17<br />
Figure 9 - Mean CPUE (Kg/Gr/Trip, with 90% CI) by Year/Month for<br />
Kigombe (Ngalawa/Mishipi), 1995-2004 ...................................................................... 17<br />
Figure 10 - Mean Annual CPUE (kg/gr/trip) for Ngalawa/Mishipi 1996-2004 from Kigombe village.<br />
Error bars represent 90% Confidence Intervals. .......................................................... 20<br />
Figure 11 - Mean Annual CPUE (kg/gr/trip) for Changu Ngalawa/Mishipi 1996-2004<br />
(with 90% Confidence Intervals) .................................................................................. 21<br />
Figure 12 - Mean CPUE (Kg/Gr/Trip, with 90% CI) by Year/Month for Kigombe<br />
(Ngalawa/Mishipi), 1995-2004 ..................................................................................... 23<br />
Figure 13 - Mean CPUE (Kg/Gr/Hr, with 90% CI) by Year/Month for Kigombe<br />
(Ngalawa/Mishipi), 2001-2004 ..................................................................................... 24<br />
Figure 14 - Mean Annual CPUE (kg/gr/trip) Ngalawa/Madema (with 90% Confidence Interval) .... 25<br />
iv


