
You also want an ePaper? Increase the reach of your titles
YUMPU automatically turns print PDFs into web optimized ePapers that Google loves.
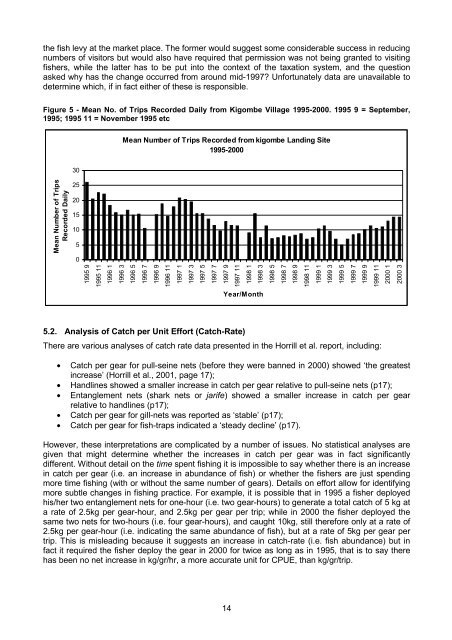
the fish levy at the market place. The former would suggest some considerable success in reducing<br />
numbers of visitors but would also have required that permission was not being granted to visiting<br />
fishers, while the latter has to be put into the context of the taxation system, and the question<br />
asked why has the change occurred from around mid-1997? Unfortunately data are unavailable to<br />
determine which, if in fact either of these is responsible.<br />
Figure 5 - Mean No. of Trips Recorded Daily from Kigombe Village 1995-2000. 1995 9 = September,<br />
1995; 1995 11 = November 1995 etc<br />
Mean Number of Trips Recorded from kigombe Landing Site<br />
1995-2000<br />
30<br />
25<br />
20<br />
15<br />
10<br />
5<br />
0<br />
1995 9<br />
1995 11<br />
1996 1<br />
1996 3<br />
1996 5<br />
1996 7<br />
1996 9<br />
1996 11<br />
1997 1<br />
1997 3<br />
1997 5<br />
1997 7<br />
1997 9<br />
1997 11<br />
1998 1<br />
1998 3<br />
1998 5<br />
1998 7<br />
1998 9<br />
1998 11<br />
Mean Number of Trips<br />
Recorded Daily<br />
1999 1<br />
1999 3<br />
1999 5<br />
1999 7<br />
1999 9<br />
1999 11<br />
2000 1<br />
2000 3<br />
Year/Month<br />
5.2. <strong>Analysis</strong> of Catch per Unit Effort (Catch-Rate)<br />
There are various analyses of catch rate data presented in the Horrill et al. report, including:<br />
• Catch per gear for pull-seine nets (before they were banned in 2000) showed ‘the greatest<br />
increase’ (Horrill et al., 2001, page 17);<br />
• Handlines showed a smaller increase in catch per gear relative to pull-seine nets (p17);<br />
• Entanglement nets (shark nets or jarife) showed a smaller increase in catch per gear<br />
relative to handlines (p17);<br />
• Catch per gear for gill-nets was reported as ‘stable’ (p17);<br />
• Catch per gear for fish-traps indicated a ‘steady decline’ (p17).<br />
However, these interpretations are complicated by a number of issues. No statistical analyses are<br />
given that might determine whether the increases in catch per gear was in fact significantly<br />
different. Without detail on the time spent fishing it is impossible to say whether there is an increase<br />
in catch per gear (i.e. an increase in abundance of fish) or whether the fishers are just spending<br />
more time fishing (with or without the same number of gears). Details on effort allow for identifying<br />
more subtle changes in fishing practice. For example, it is possible that in 1995 a fisher deployed<br />
his/her two entanglement nets for one-hour (i.e. two gear-hours) to generate a total catch of 5 kg at<br />
a rate of 2.5kg per gear-hour, and 2.5kg per gear per trip; while in 2000 the fisher deployed the<br />
same two nets for two-hours (i.e. four gear-hours), and caught 10kg, still therefore only at a rate of<br />
2.5kg per gear-hour (i.e. indicating the same abundance of fish), but at a rate of 5kg per gear per<br />
trip. This is misleading because it suggests an increase in catch-rate (i.e. fish abundance) but in<br />
fact it required the fisher deploy the gear in 2000 for twice as long as in 1995, that is to say there<br />
has been no net increase in kg/gr/hr, a more accurate unit for CPUE, than kg/gr/trip.<br />
14