
Create successful ePaper yourself
Turn your PDF publications into a flip-book with our unique Google optimized e-Paper software.
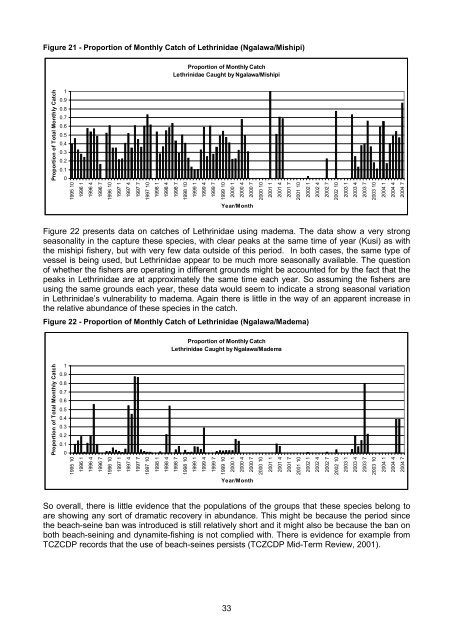
Figure 21 - Proportion of Monthly Catch of Lethrinidae (Ngalawa/Mishipi)<br />
Proportion of Monthly Catch<br />
Lethrinidae Caught by Ngalawa/Mishipi<br />
1<br />
0.9<br />
0.8<br />
0.7<br />
0.6<br />
0.5<br />
0.4<br />
0.3<br />
0.2<br />
0.1<br />
0<br />
1995 10<br />
1996 1<br />
1996 4<br />
1996 7<br />
1996 10<br />
1997 1<br />
1997 4<br />
1997 7<br />
1997 10<br />
1998 1<br />
1998 4<br />
1998 7<br />
1998 10<br />
1999 1<br />
1999 4<br />
1999 7<br />
1999 10<br />
2000 1<br />
2000 4<br />
2000 7<br />
2000 10<br />
2001 1<br />
2001 4<br />
2001 7<br />
2001 10<br />
2002 1<br />
2002 4<br />
2002 7<br />
2002 10<br />
2003 1<br />
2003 4<br />
2003 7<br />
2003 10<br />
Proportion of Total Monthly Catch<br />
2004 1<br />
2004 4<br />
2004 7<br />
Year/Month<br />
Figure 22 presents data on catches of Lethrinidae using madema. The data show a very strong<br />
seasonality in the capture these species, with clear peaks at the same time of year (Kusi) as with<br />
the mishipi fishery, but with very few data outside of this period. In both cases, the same type of<br />
vessel is being used, but Lethrinidae appear to be much more seasonally available. The question<br />
of whether the fishers are operating in different grounds might be accounted for by the fact that the<br />
peaks in Lethrinidae are at approximately the same time each year. So assuming the fishers are<br />
using the same grounds each year, these data would seem to indicate a strong seasonal variation<br />
in Lethrinidae’s vulnerability to madema. Again there is little in the way of an apparent increase in<br />
the relative abundance of these species in the catch.<br />
Figure 22 - Proportion of Monthly Catch of Lethrinidae (Ngalawa/Madema)<br />
Proportion of Monthly Catch<br />
Lethrinidae Caught by Ngalawa/Madema<br />
Proportion of Total Monthly Catch<br />
1<br />
0.9<br />
0.8<br />
0.7<br />
0.6<br />
0.5<br />
0.4<br />
0.3<br />
0.2<br />
0.1<br />
0<br />
1995 10<br />
1996 1<br />
1996 4<br />
1996 7<br />
1996 10<br />
1997 1<br />
1997 4<br />
1997 7<br />
1997 10<br />
1998 1<br />
1998 4<br />
1998 7<br />
1998 10<br />
1999 1<br />
1999 4<br />
1999 7<br />
1999 10<br />
2000 1<br />
2000 4<br />
2000 7<br />
2000 10<br />
2001 1<br />
2001 4<br />
2001 7<br />
2001 10<br />
2002 1<br />
2002 4<br />
2002 7<br />
2002 10<br />
2003 1<br />
2003 4<br />
2003 7<br />
2003 10<br />
2004 1<br />
2004 4<br />
2004 7<br />
Year/Month<br />
So overall, there is little evidence that the populations of the groups that these species belong to<br />
are showing any sort of dramatic recovery in abundance. This might be because the period since<br />
the beach-seine ban was introduced is still relatively short and it might also be because the ban on<br />
both beach-seining and dynamite-fishing is not complied with. There is evidence for example from<br />
TCZCDP records that the use of beach-seines persists (TCZCDP Mid-Term Review, 2001).<br />
33