You also want an ePaper? Increase the reach of your titles
YUMPU automatically turns print PDFs into web optimized ePapers that Google loves.
profile of the sampled data was not equal within year; that is to say that some years had relatively<br />
few data, or data that were primarily taken from one season or another, and apparent seasonal<br />
differences in CPUE had already been observed in the data. Therefore to minimize any bias<br />
associated with this, and yet to maximize the amount of data that could legitimately be included,<br />
the period of March to February was taken as a ‘year’ and the years 1996/97, 1997/98, 1998/99,<br />
1999/00 and 2003/04 were compared.<br />
The data were tested for normality using both Excel Descriptive Statistics and Systat (V.10.2) using<br />
the Kolmogorov-Smirnov one-sample test reporting skewness and kurtosis. The data does appear<br />
to show some deviation from normality revealing positiveness skewness (a long right-tail) and<br />
positive kurtosis (longer tails than expected). In this case a nonparametric analysis of variance (e.g.<br />
Kruskal-Wallis Test) might be considered appropriate but Zar (1999) indicates that a single-factor<br />
analysis of variance (such as is proposed here, the single-factor being CPUE):<br />
‘…is also robust with respect to the assumption of the underlying populations’ normality. The<br />
validity of the analysis is affected only slightly by even considerable deviations from normality (in<br />
skewness and/or kurtosis), especially as n increases.’ (Zar, 1999, p185)<br />
Given that the number of groups (years) was relatively small (five) the Bonferroni Test (also<br />
available as a post-hoc test in Systat) was used to double check the findings of the Tukey test.<br />
Statistical tests differ in their power hence the double-check using the Bonferroni test (Simon<br />
Nicholson, pers. comm.). The results of these analyses are presented in Section 7 and more<br />
details on the equations employed are presented in Appendix 2 - Description of Pair-wise<br />
Comparisons.<br />
7. Results from analysis of the fisheries data<br />
7.1. Total Catch and Value for the Region, by District and by CMA<br />
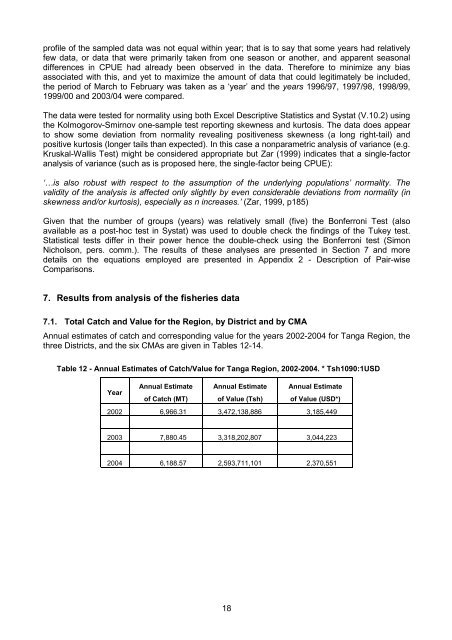
Annual estimates of catch and corresponding value for the years 2002-2004 for <strong>Tanga</strong> Region, the<br />
three Districts, and the six CMAs are given in Tables 12-14.<br />
Table 12 - Annual Estimates of Catch/Value for <strong>Tanga</strong> Region, 2002-2004. * Tsh1090:1USD<br />
Annual Estimate Annual Estimate Annual Estimate<br />
Year<br />
of Catch (MT) of Value (Tsh) of Value (USD*)<br />
2002 6,966.31 3,472,138,886 3,185,449<br />
2003 7,880.45 3,318,202,807 3,044,223<br />
2004 6,188.57 2,593,711,101 2,370,551<br />
18


