Annual report and financial statements 2011 - Analist.nl
Annual report and financial statements 2011 - Analist.nl
Annual report and financial statements 2011 - Analist.nl
Create successful ePaper yourself
Turn your PDF publications into a flip-book with our unique Google optimized e-Paper software.
100<br />
Notes to the <strong>financial</strong> <strong>statements</strong> continued<br />
23 Financial instruments continued<br />
The floating rate sterling <strong>and</strong> euro borrowings are linked to interest rates related to LIBOR. These rates are for periods between one <strong>and</strong><br />
three months.<br />
As at the balance sheet date <strong>and</strong> excluding finance leases, the fixed rate sterling borrowings are at an average rate of 5.9% (last year<br />
5.9%) <strong>and</strong> the weighted average time for which the rate is fixed is nine years (last year ten years).<br />
(d) Interest rate risk<br />
The Group is exposed to interest rate risk in relation to the sterling, US dollar, euro <strong>and</strong> Hong Kong dollar variable rate <strong>financial</strong> assets<br />
<strong>and</strong> liabilities.<br />
The Group’s policy is to use derivative contracts where necessary to maintain a mix of fixed <strong>and</strong> floating rate borrowings to manage this<br />
risk. The structure <strong>and</strong> maturity of these derivatives correspond to the underlying borrowings <strong>and</strong> are accounted for as fair value or cash<br />
flow hedges as appropriate.<br />
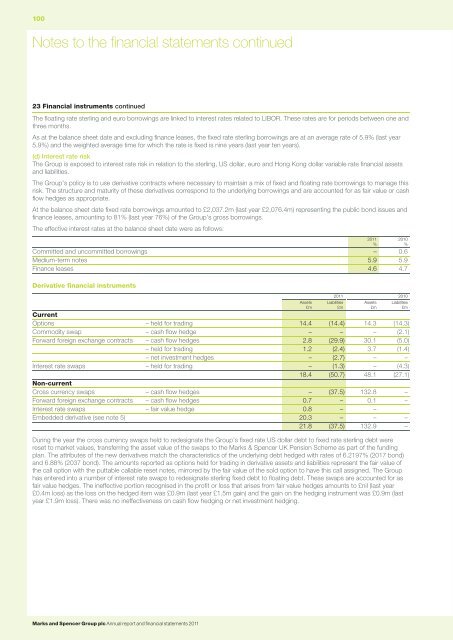
At the balance sheet date fixed rate borrowings amounted to £2,037.2m (last year £2,076.4m) representing the public bond issues <strong>and</strong><br />
finance leases, amounting to 81% (last year 76%) of the Group’s gross borrowings.<br />
The effective interest rates at the balance sheet date were as follows:<br />
Committed <strong>and</strong> uncommitted borrowings – 0.6<br />
Medium-term notes 5.9 5.9<br />
Finance leases 4.6 4.7<br />
<strong>2011</strong><br />
%<br />
2010<br />
%<br />
Derivative <strong>financial</strong> instruments<br />
Assets<br />
£m<br />
<strong>2011</strong> 2010<br />
Current<br />
Options – held for trading 14.4 (14.4) 14.3 (14.3)<br />
Commodity swap – cash flow hedge – – – (2.1)<br />
Forward foreign exchange contracts – cash flow hedges 2.8 (29.9) 30.1 (5.0)<br />
– held for trading 1.2 (2.4) 3.7 (1.4)<br />
– net investment hedges – (2.7) – –<br />
Interest rate swaps – held for trading – (1.3) – (4.3)<br />
18.4 (50.7) 48.1 (27.1)<br />
Non-current<br />
Cross currency swaps – cash flow hedges – (37.5) 132.8 –<br />
Forward foreign exchange contracts – cash flow hedges 0.7 – 0.1 –<br />
Interest rate swaps – fair value hedge 0.8 – –<br />
Embedded derivative (see note 5) 20.3 – – –<br />
21.8 (37.5) 132.9 –<br />
During the year the cross currency swaps held to redesignate the Group’s fixed rate US dollar debt to fixed rate sterling debt were<br />
reset to market values, transferring the asset value of the swaps to the Marks & Spencer UK Pension Scheme as part of the funding<br />
plan. The attributes of the new derivatives match the characteristics of the underlying debt hedged with rates of 6.2197% (2017 bond)<br />
<strong>and</strong> 6.88% (2037 bond). The amounts <strong>report</strong>ed as options held for trading in derivative assets <strong>and</strong> liabilities represent the fair value of<br />
the call option with the puttable callable reset notes, mirrored by the fair value of the sold option to have this call assigned. The Group<br />
has entered into a number of interest rate swaps to redesignate sterling fixed debt to floating debt. These swaps are accounted for as<br />
fair value hedges. The ineffective portion recognised in the profit or loss that arises from fair value hedges amounts to £nil (last year<br />
£0.4m loss) as the loss on the hedged item was £0.9m (last year £1.5m gain) <strong>and</strong> the gain on the hedging instrument was £0.9m (last<br />
year £1.9m loss). There was no ineffectiveness on cash flow hedging or net investment hedging.<br />
Liabilities<br />
£m<br />
Assets<br />
£m<br />
Liabilities<br />
£m<br />
Marks <strong>and</strong> Spencer Group plc <strong>Annual</strong> <strong>report</strong> <strong>and</strong> <strong>financial</strong> <strong>statements</strong> <strong>2011</strong>


