

Annual report and financial statements 2011 - Analist.nl
Annual report and financial statements 2011 - Analist.nl
Annual report and financial statements 2011 - Analist.nl

Create successful ePaper yourself
Turn your PDF publications into a flip-book with our unique Google optimized e-Paper software.
10<br />
Our<br />
performance<br />
Financial performance<br />
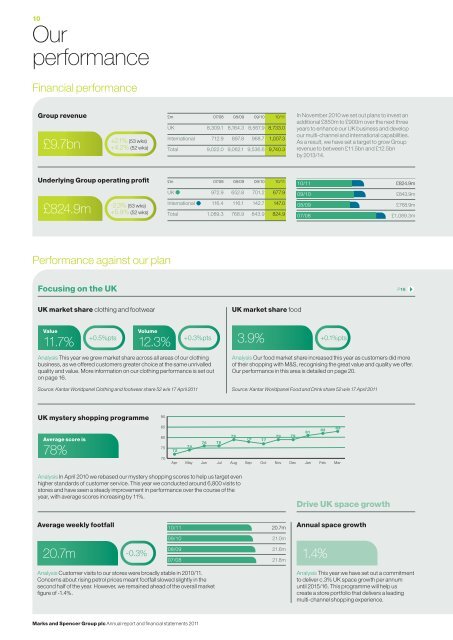
Group revenue<br />
£9.7bn<br />
+2.1% (53 wks)<br />
+4.2% (52 wks)<br />
£m 07/08 08/09 09/10 10/11<br />
UK 8,309.1 8,164.3 8,567.9 8,733.0<br />
International 712.9 897.8 968.7 1,007.3<br />
Total 9,022.0 9,062.1 9,536.6 9,740.3<br />
In November 2010 we set out plans to invest an<br />
additional £850m to £900m over the next three<br />
years to enhance our UK business <strong>and</strong> develop<br />
our multi-channel <strong>and</strong> international capabilities.<br />
As a result, we have set a target to grow Group<br />
revenue to between £11.5bn <strong>and</strong> £12.5bn<br />
by 2013/14.<br />
Underlying Group operating profit<br />
£m 07/08 08/09 09/10 10/11<br />
10/11<br />
£824.9m<br />
£824.9m<br />
-2.3% (53 wks)<br />
+5.9% (52 wks)<br />
UK 972.9 652.8 701.2 677.9<br />
International 116.4 116.1 142.7 147.0<br />
Total 1,089.3 768.9 843.9 824.9<br />
09/10<br />
08/09<br />
07/08<br />
£843.9m<br />
£768.9m<br />
£1,089.3m<br />
Performance against our plan<br />
Focusing on the UK<br />
P16<br />
UK market share clothing <strong>and</strong> footwear<br />
UK market share food<br />
Value<br />
11.7%<br />
Volume<br />
+0.5%pts +0.3%pts<br />
12.3% 3.9%<br />
+0.1%pts<br />
Analysis This year we grew market share across all areas of our clothing<br />
business, as we offered customers greater choice at the same unrivalled<br />
quality <strong>and</strong> value. More information on our clothing performance is set out<br />
on page 16.<br />
Analysis Our food market share increased this year as customers did more<br />
of their shopping with M&S, recognising the great value <strong>and</strong> quality we offer.<br />
Our performance in this area is detailed on page 20.<br />
Source: Kantar Worldpanel Clothing <strong>and</strong> footwear share 52 w/e 17 April <strong>2011</strong><br />
Source: Kantar Worldpanel Food <strong>and</strong> Drink share 52 w/e 17 April <strong>2011</strong><br />
UK mystery shopping programme<br />
Average score is<br />
78%<br />
90<br />
85<br />
80<br />
75<br />
70<br />
81<br />
82<br />
83<br />
79<br />
79 79<br />
78 77<br />
76 76<br />
74<br />
72<br />
Apr May Jun Jul Aug Sep Oct Nov Dec Jan Feb Mar<br />
Analysis In April 2010 we rebased our mystery shopping scores to help us target even<br />
higher st<strong>and</strong>ards of customer service. This year we conducted around 6,800 visits to<br />
stores <strong>and</strong> have seen a steady improvement in performance over the course of the<br />
year, with average scores increasing by 11%.<br />
Drive UK space growth<br />
Average weekly footfall<br />
10/11<br />
20.7m<br />
<strong>Annual</strong> space growth<br />
20.7m -0.3%<br />
09/10<br />
08/09<br />
07/08<br />
21.0m<br />
21.6m<br />
21.8m<br />
1.4%<br />
Analysis Customer visits to our stores were broadly stable in 2010/11.<br />
Concerns about rising petrol prices meant footfall slowed slightly in the<br />
second half of the year. However, we remained ahead of the overall market<br />
figure of -1.4%.<br />
Analysis This year we have set out a commitment<br />
to deliver c.3% UK space growth per annum<br />
until 2015/16. This programme will help us<br />
create a store portfolio that delivers a leading<br />
multi-channel shopping experience.<br />
Marks <strong>and</strong> Spencer Group plc <strong>Annual</strong> <strong>report</strong> <strong>and</strong> <strong>financial</strong> <strong>statements</strong> <strong>2011</strong>


