

Annual report and financial statements 2011 - Analist.nl
Annual report and financial statements 2011 - Analist.nl
Annual report and financial statements 2011 - Analist.nl

You also want an ePaper? Increase the reach of your titles
YUMPU automatically turns print PDFs into web optimized ePapers that Google loves.
101<br />
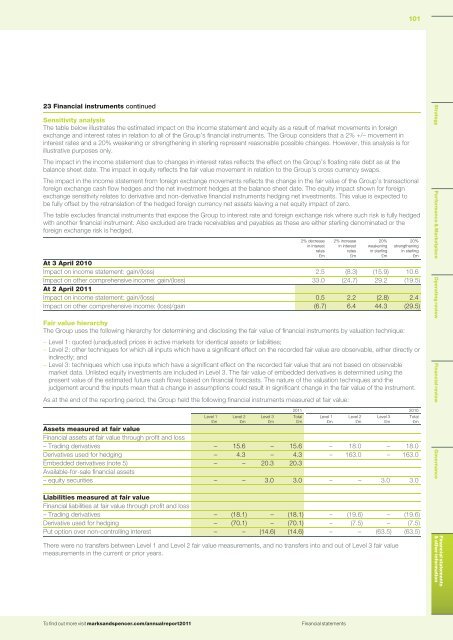
23 Financial instruments continued<br />
Sensitivity analysis<br />
The table below illustrates the estimated impact on the income statement <strong>and</strong> equity as a result of market movements in foreign<br />
exchange <strong>and</strong> interest rates in relation to all of the Group’s <strong>financial</strong> instruments. The Group considers that a 2% +/– movement in<br />
interest rates <strong>and</strong> a 20% weakening or strengthening in sterling represent reasonable possible changes. However, this analysis is for<br />
illustrative purposes o<strong>nl</strong>y.<br />
The impact in the income statement due to changes in interest rates reflects the effect on the Group’s floating rate debt as at the<br />
balance sheet date. The impact in equity reflects the fair value movement in relation to the Group’s cross currency swaps.<br />
The impact in the income statement from foreign exchange movements reflects the change in the fair value of the Group’s transactional<br />
foreign exchange cash flow hedges <strong>and</strong> the net investment hedges at the balance sheet date. The equity impact shown for foreign<br />
exchange sensitivity relates to derivative <strong>and</strong> non-derivative <strong>financial</strong> instruments hedging net investments. This value is expected to<br />
be fully offset by the retranslation of the hedged foreign currency net assets leaving a net equity impact of zero.<br />
The table excludes <strong>financial</strong> instruments that expose the Group to interest rate <strong>and</strong> foreign exchange risk where such risk is fully hedged<br />
with another <strong>financial</strong> instrument. Also excluded are trade receivables <strong>and</strong> payables as these are either sterling denominated or the<br />
foreign exchange risk is hedged.<br />
2% decrease<br />
in interest<br />
rates<br />
£m<br />
2% increase<br />
in interest<br />
rates<br />
£m<br />
20%<br />
weakening<br />
in sterling<br />
£m<br />
20%<br />
strengthening<br />
in sterling<br />
£m<br />
At 3 April 2010<br />
Impact on income statement: gain/(loss) 2.5 (8.3) (15.9) 10.6<br />
Impact on other comprehensive income: gain/(loss) 33.0 (24.7) 29.2 (19.5)<br />
At 2 April <strong>2011</strong><br />
Impact on income statement: gain/(loss) 0.5 2.2 (2.8) 2.4<br />
Impact on other comprehensive income: (loss)/gain (6.7) 6.4 44.3 (29.5)<br />
Fair value hierarchy<br />
The Group uses the following hierarchy for determining <strong>and</strong> disclosing the fair value of <strong>financial</strong> instruments by valuation technique:<br />
–Level 1: quoted (unadjusted) prices in active markets for identical assets or liabilities;<br />
–Level 2: other techniques for which all inputs which have a significant effect on the recorded fair value are observable, either directly or<br />
indirectly; <strong>and</strong><br />
–Level 3: techniques which use inputs which have a significant effect on the recorded fair value that are not based on observable<br />
market data. U<strong>nl</strong>isted equity investments are included in Level 3. The fair value of embedded derivatives is determined using the<br />
present value of the estimated future cash flows based on <strong>financial</strong> forecasts. The nature of the valuation techniques <strong>and</strong> the<br />
judgement around the inputs mean that a change in assumptions could result in significant change in the fair value of the instrument.<br />
As at the end of the <strong>report</strong>ing period,<br />
the Group held the following <strong>financial</strong> instruments measured at fair value:<br />
Level 1<br />
£m<br />
<strong>2011</strong> 2010<br />
Assets measured at fair value<br />
Financial assets at fair value through profit <strong>and</strong> loss<br />
– Trading derivatives – 15.6 – 15.6 – 18.0 – 18.0<br />
Derivatives used for hedging – 4.3 – 4.3 – 163.0 – 163.0<br />
Embedded derivatives (note 5) – – 20.3 20.3<br />
Available-for-sale <strong>financial</strong> assets<br />
– equity securities – – 3.0 3.0 – – 3.0 3.0<br />
Level 2<br />
£m<br />
Level 3<br />
£m<br />
Total<br />
£m<br />
Level 1<br />
£m<br />
Level 2<br />
£m<br />
Level 3<br />
£m<br />
Total<br />
£m<br />
Strategy Performance & Marketplace Operating review Financial review Governance<br />
Liabilities measured at fair value<br />
Financial liabilities at fair value through profit <strong>and</strong> loss<br />
– Trading derivatives – (18.1) – (18.1) – (19.6) – (19.6)<br />
Derivative used for hedging – (70.1) – (70.1) – (7.5) – (7.5)<br />
Put option over non-controlling interest – – (14.6) (14.6) – – (63.5) (63.5)<br />
There were no transfers between Level 1 <strong>and</strong> Level 2 fair value measurements, <strong>and</strong> no transfers into <strong>and</strong> out of Level 3 fair value<br />
measurements in the current or prior years.<br />
Financial <strong>statements</strong><br />
& other information<br />
To find out more visit marks<strong>and</strong>spencer.com/annual<strong>report</strong><strong>2011</strong><br />
Financial <strong>statements</strong>


