

Annual report and financial statements 2011 - Analist.nl
Annual report and financial statements 2011 - Analist.nl
Annual report and financial statements 2011 - Analist.nl

Create successful ePaper yourself
Turn your PDF publications into a flip-book with our unique Google optimized e-Paper software.
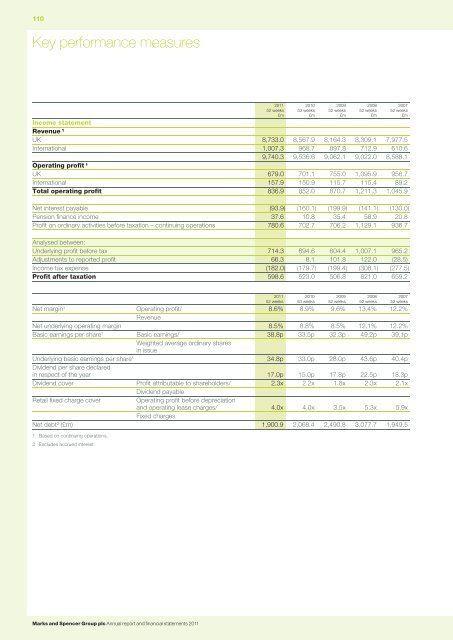
110<br />
Key performance measures<br />
<strong>2011</strong><br />
52 weeks<br />
£m<br />
2010<br />
53 weeks<br />
£m<br />
2009<br />
52 weeks<br />
£m<br />
2008<br />
52 weeks<br />
£m<br />
2007<br />
52 weeks<br />
£m<br />
Income statement<br />
Revenue ¹<br />
UK 8,733.0 8,567.9 8,164.3 8,309.1 7,977.5<br />
International 1,007.3 968.7 897.8 712.9 610.6<br />
9,740.3 9,536.6 9,062.1 9,022.0 8,588.1<br />
Operating profit ¹<br />
UK 679.0 701.1 755.0 1,095.9 956.7<br />
International 157.9 150.9 115.7 115.4 89.2<br />
Total operating profit 836.9 852.0 870.7 1,211.3 1,045.9<br />
Net interest payable (93.9) (160.1) (199.9) (141.1) (130.0)<br />
Pension finance income 37.6 10.8 35.4 58.9 20.8<br />
Profit on ordinary activities before taxation – continuing operations 780.6 702.7 706.2 1,129.1 936.7<br />
Analysed between:<br />
Underlying profit before tax 714.3 694.6 604.4 1,007.1 965.2<br />
Adjustments to <strong>report</strong>ed profit<br />
66.3 8.1 101.8 122.0 (28.5)<br />
Income tax expense (182.0) (179.7) (199.4) (308.1) (277.5)<br />
Profit after taxation 598.6 523.0 506.8 821.0 659.2<br />
<strong>2011</strong><br />
52 weeks<br />
2010<br />
53 weeks<br />
2009<br />
52 weeks<br />
2008<br />
52 weeks<br />
2007<br />
52 weeks<br />
Net margin¹ Operating profit/ 8.6% 8.9% 9.6% 13.4% 12.2%<br />
Revenue<br />
Net underlying operating margin 8.5% 8.8% 8.5% 12.1% 12.2%<br />
Basic earnings per share¹ Basic earnings/ 38.8p 33.5p 32.3p 49.2p 39.1p<br />
Weighted average ordinary shares<br />
in issue<br />
Underlying basic earnings per share¹ 34.8p 33.0p 28.0p 43.6p 40.4p<br />
Dividend per share declared<br />
in respect of the year 17.0p 15.0p 17.8p 22.5p 18.3p<br />
Dividend cover Profit attributable to shareholders/ 2.3x 2.2x 1.8x 2.3x 2.1x<br />
Dividend payable<br />
Retail fixed charge cover<br />
Operating profit before depreciation<br />
<strong>and</strong> operating lease charges/ 4.0x 4.0x 3.5x 5.3x 5.9x<br />
Fixed charges<br />
Net debt² (£m) 1,900.9 2,068.4 2,490.8 3,077.7 1,949.5<br />
1 Based on continuing operations.<br />
2 Excludes accrued interest.<br />
Marks <strong>and</strong> Spencer Group plc <strong>Annual</strong> <strong>report</strong> <strong>and</strong> <strong>financial</strong> <strong>statements</strong> <strong>2011</strong>


