baltic states and belarus real estate market review - Colliers
baltic states and belarus real estate market review - Colliers
baltic states and belarus real estate market review - Colliers

You also want an ePaper? Increase the reach of your titles
YUMPU automatically turns print PDFs into web optimized ePapers that Google loves.
Real Estate Market Review 2011 | Estonia Office Market<br />
Office Market<br />
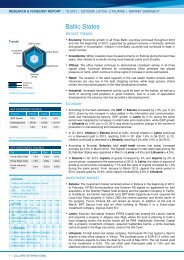
OVERVIEW<br />
After poor conditions <strong>and</strong> high vacancy in<br />
2009 the office <strong>market</strong> had begun to firm<br />
coming into 2010. Entering 2010 it appeared<br />
that rental <strong>and</strong> vacancy rates would remain<br />
relatively stable. However, coming into the<br />
year with a significant oversupply, no<br />
dramatic recovery was expected <strong>and</strong> no<br />
significant office projects were anticipated to<br />
be added to the <strong>market</strong>. The year saw<br />
vacancy rates gradually decrease <strong>and</strong> the<br />
situation in the office sector in 2010 started<br />
to improve particularly for l<strong>and</strong>lords who<br />
were flexible with lease terms <strong>and</strong> pricing.<br />
The vacancy rate in A <strong>and</strong> B1 office buildings<br />
started to decrease slightly in the second half<br />
of the year.<br />
Supply<br />
As no new premises were added to the<br />
<strong>market</strong> during 2010, the total office stock in<br />
Tallinn remained at 473,500 sqm. After the<br />
first half of 2009, when approx 51,700 sqm<br />
of new supply entered the <strong>market</strong>,<br />
development in the Tallinn office <strong>market</strong> <strong>and</strong><br />
supply of new properties has ceased due to<br />
unfavourable economic conditions, an<br />
oversupply of office premises, <strong>and</strong> a high<br />
cost or absence of liquidity in the <strong>market</strong>. By<br />
the end of 2010, several developers<br />
considered possibilities for establishing new<br />
office buildings in two-three years time.<br />
Due to the relatively large speculative risk, it<br />
is crucial for developers to have a very good<br />
capitalisation <strong>and</strong> a high proportion of<br />
pre-lease tenants before starting construction<br />
works.<br />
By the end of 2010, the total stock of office<br />
space in CBD area accounted for 42 per cent<br />
of total Tallinn stock. While 65 per cent of<br />
new supply in 2005 came onto the <strong>market</strong> in<br />
the CBD <strong>and</strong> 51 per cent of new supply in<br />
2006 came onto the <strong>market</strong> in the Kesklinn<br />
(Centre City) district, over the next two years<br />
(2007 <strong>and</strong> 2008) the most dynamic<br />
development of new office properties was<br />
outside the CBD - in the Lasnamäe district<br />
(mainly in Ülemiste City), comprising 39 per<br />
cent <strong>and</strong> 34 per cent of new supply in Tallinn<br />
during that period respectively. Half of new<br />
supply in 2009 was developed in CBD.<br />
By the end of 2010, Class A premises<br />
accounted for about 10 per cent<br />
(49,400 sqm) of the total stock of speculative<br />
(not built-to-suit) office buildings in Tallinn,<br />
Class B1 for 54 per cent (254,900 sqm), <strong>and</strong><br />
Class B2 for 36 per cent (169,200 sqm) of<br />
total stock.<br />
The volume of occupancy permissions issued<br />
for office <strong>and</strong> administration buildings in<br />
Tallinn during 2010 decreased by 51 per cent<br />
compared to the same period in 2009<br />
(140,275 sqm in 2010 <strong>and</strong> 284,916 sqm in<br />
2009), while the volume of building<br />
permissions issued for office <strong>and</strong><br />
administration buildings in Tallinn in 2010<br />
comprised only 5,789 sqm. The majority of<br />
volume of issued occupancy permissions in<br />
Tallinn in 2010 was for office <strong>and</strong><br />
Distribution of Speculative<br />
Office Space in tallinn by<br />
Class<br />
Dynamics of Office Space in Tallinn<br />
f - forecasts<br />
500<br />
450<br />
54%<br />
400<br />
Sqm (000s)<br />
350<br />
300<br />
250<br />
200<br />
10%<br />
36%<br />
150<br />
100<br />
50<br />
Class A Class B1 Class B2<br />
0<br />
2001 2002 2003 2004 2005 2006 2007 2008 2009 2010 2011f<br />
Total Stock New Construction Built-to-suit Expected Construction<br />
CONTACT: AVO RÕÕMUSSAAR - a.roomussaar@colliers.ee<br />
<strong>Colliers</strong> International | p. 54