guide to thin section microscopy - Mineralogical Society of America
guide to thin section microscopy - Mineralogical Society of America
guide to thin section microscopy - Mineralogical Society of America

You also want an ePaper? Increase the reach of your titles
YUMPU automatically turns print PDFs into web optimized ePapers that Google loves.
Guide <strong>to</strong> Thin Section Microscopy<br />
Conoscopy<br />
4.2.5.2 Conoscopy <strong>of</strong> optically anisotropic crystals<br />
In the conoscopic mode, waves deviating from vertical incidence by increasing tilt angles<br />
travel increasing distances wi<strong>thin</strong> the birefringent crystal. According <strong>to</strong> the relationship Γ = d<br />
* (n z ' – n x ') described in chapter 4.2.3, it has <strong>to</strong> be concluded that the retardation Γ <strong>of</strong> the<br />
waves increases with increasing angles due <strong>to</strong> the continuous increase <strong>of</strong> d' (= length <strong>of</strong> the<br />
light path in the crystal plate). Accordingly, the interference colours in a conoscopic<br />
interference figure should generally increase outwards. However, the interference figure is <strong>to</strong><br />
a much larger extent controlled by the orientation <strong>of</strong> the vibration directions and the<br />
birefringence values <strong>of</strong> the wave couplets wi<strong>thin</strong> the observed volume <strong>of</strong> the anisotropic<br />
crystal. As described previously, the birefringence for waves parallel <strong>to</strong> optic axes is zero.<br />
It increases as the angle between the optic axis and ray propagation direction (or wave<br />
normal, <strong>to</strong> be precise) increases.<br />
Raith, Raase & Reinhardt – February 2012<br />
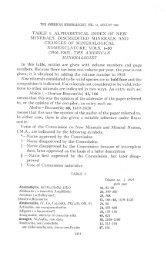
Figure 4-48: Generation <strong>of</strong> an interference figure in the upper focal plane <strong>of</strong> the objective by<br />
imaging <strong>of</strong> parallel sets <strong>of</strong> rays that pass the crystal plate at different angles. The example<br />
shows these relationships for a uniaxial crystal (calcite) cut perpendicular <strong>to</strong> the optic axis.<br />
The geometry <strong>of</strong> interference figures obtained from anisotropic crystals can be illustrated<br />
with the model <strong>of</strong> the skiodrome sphere developed by Becke (1905). The crystal is considered<br />
<strong>to</strong> occupy the centre <strong>of</strong> a sphere. Each ray propagation direction <strong>of</strong> light waves wi<strong>thin</strong> the<br />
crystal has a corresponding point on the spherical surface where the ray pierces that surface.<br />
In each <strong>of</strong> these points, the vibration directions <strong>of</strong> the related waves can be shown as a<br />
tangent (e.g., O and E in case <strong>of</strong> optically uniaxial minerals). When connecting all the<br />
tangents <strong>of</strong> equal vibration direction, a geometric mesh <strong>of</strong> vibration directions is generated<br />
that depends on the optical symmetry <strong>of</strong> the crystal (Fig. 4-49,50).<br />
114